Lihat juga

 16.06.2026 05:41 AM
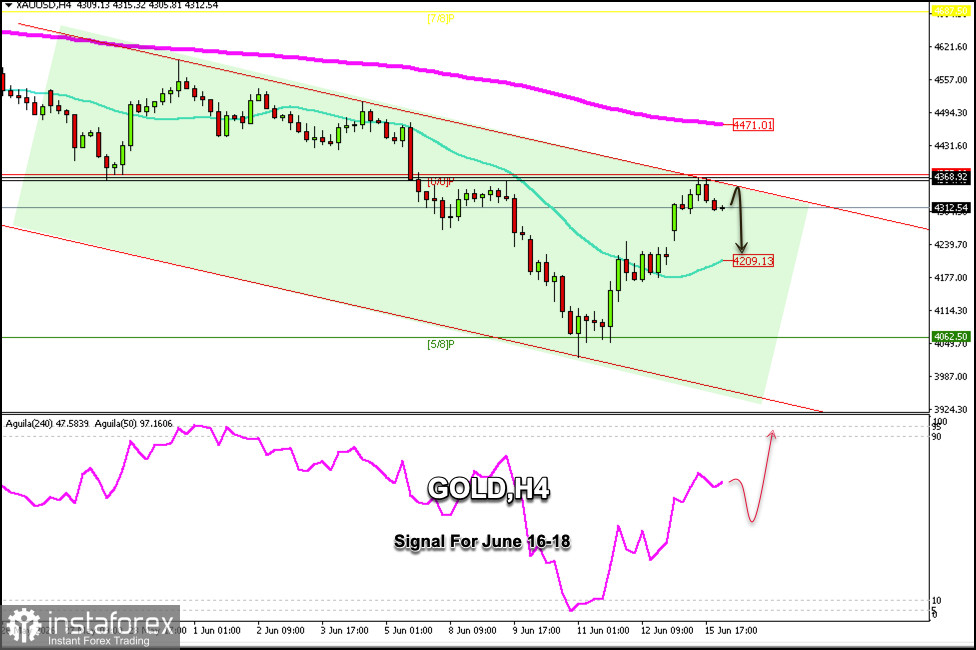
Gold is trading around $4,312, pulling back after reaching the upper band of the downtrend channel, which coincided with the 6/8 Murray line. On the H4 chart, we can see that XAU/USD reached its high on June 8 and then began a strong downtrend in the following days.
If, in the coming hours, there is a pullback toward the upper band of the downtrend channel at $4,350 and the price fails to consolidate above the 6/8 Murray line, this zone could be considered an opportunity to open short positions with targets at the 21 SMA, located around $4,209.
We can see on the H4 chart that gold left a gap at the opening of this week's trading, and it is likely to fall in the coming days and fill this gap around $4,220.
This gap would give us a clear signal for a bearish strategy, so we must be cautious and monitor whether the price remains below the 6/8 Murray level. Any technical rebound would then be seen as an opportunity to open short positions.
A consolidation above $4,368 could signal a new bullish trend for gold, and we could expect it to reach the 200 EMA around $4,471 and potentially even hit the 7/8 Murray line around $4,687.
If the price consolidates below $4,209 (21 SMA) in the coming days, the scenario could change, and we might expect a pullback toward the 5/8 Murray level around $4,062. Gold could even reach the lower band of the downtrend channel around $3,935.
Given that the Eagle indicator is showing a positive signal, we could expect a correction toward the 21 SMA to resume long positions with targets at the 6/8 Murray level and ultimately at the 200 EMA around $4,471.
You have already liked this post today
*Analisis pasar yang diposting disini dimaksudkan untuk meningkatkan pengetahuan Anda namun tidak untuk memberi instruksi trading.


