Lihat juga

 18.03.2026 06:51 AM
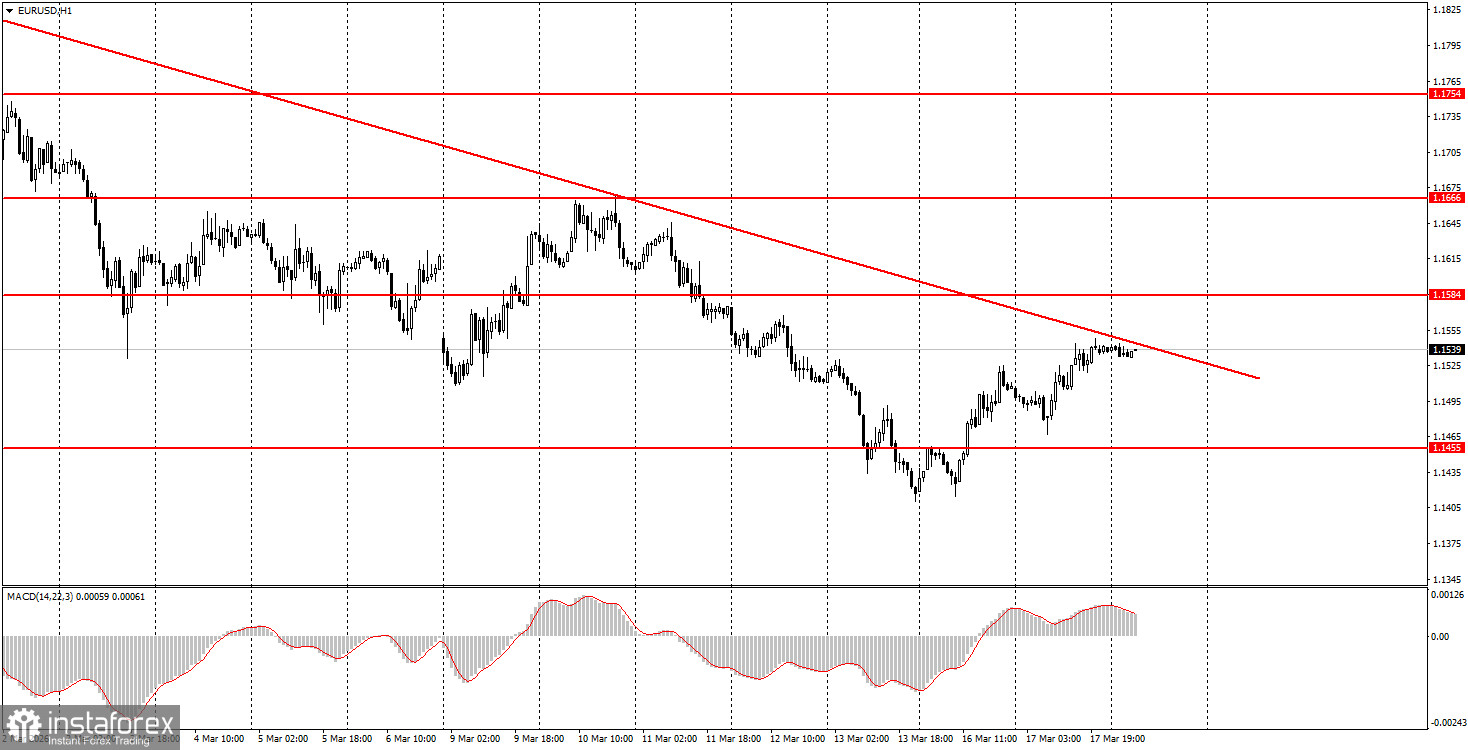
The EUR/USD currency pair continued its upward movement on Tuesday for the second consecutive day, without any substantial local or macroeconomic factors. It is likely a simple correction for now, but if the descending trendline breaks, the trend could shift to bullish, and the dollar cannot keep rising indefinitely on the same factor. Let's recall that several trendline breaks have occurred in the last month and a half, but in each case, external factors prevented bulls from starting their trend. This cannot go on forever. We do not believe that the geopolitical factor will positively impact the dollar for another month, two, or even a year, while the market desperately ignores all other factors. The upward trend on the daily time frame remains intact, so we, as before, expect it to resume. The war in the Middle East has certainly influenced the technical picture, but globally, it hasn't changed anything for the prospects of the American currency.
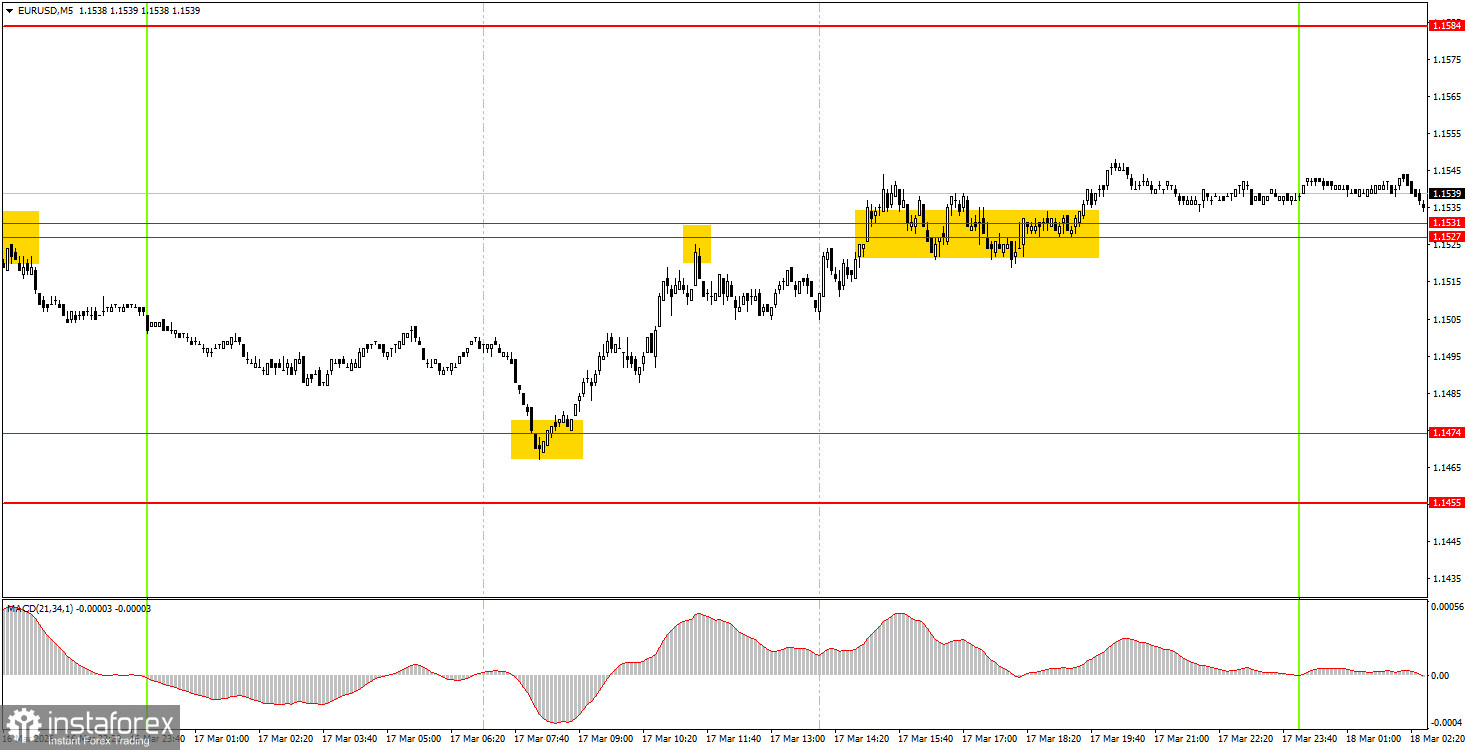
On the 5-minute time frame, three trading signals were generated on Tuesday. During the European trading session, the price bounced off the 1.1474 level and, a few hours later, reached the nearest target – the area of 1.1527-1.1531 (with minimal error). This area could also be exploited, but this signal turned out to be false. The next buy signal in the same area could be marked by novice traders as a long position, which remains relevant.
On the hourly time frame, the downward trend is maintained due to the war in the Middle East, but it could be canceled today. As of early 2026, a long-term upward trend has resumed, so we await renewed medium-term growth for the euro. The overall fundamental background remains very challenging for the US currency, as confirmed by reports on the labor market, GDP, and unemployment. However, geopolitics remains the main focus for the market rather than the economy.
On Wednesday, novice traders may consider new short positions if the price settles below the 1.1527-1.1531 area, targeting 1.1455-1.1474. If the price is above the 1.1527-1.1531 area, long positions can be maintained with targets at 1.1584-1.1591.
On the 5-minute time frame, the following levels should be considered: 1.1267-1.1292, 1.1354-1.1363, 1.1413, 1.1455-1.1474, 1.1527-1.1531, 1.1584-1.1591, 1.1655-1.1666, 1.1745-1.1754, 1.1830-1.1837, 1.1899-1.1908. On Wednesday, only secondary reports are planned in the US and the Eurozone, but in the evening, the Fed will announce the results of its second meeting of the year and provide an updated "dot plot" schedule. After the meeting, Jerome Powell will give a speech.
Price levels of support and resistance are levels that serve as targets when opening buys or sells. Take Profit levels can be placed around them.
Red lines represent channels or trend lines that show the current trend and indicate the direction in which it is preferable to trade now.
The MACD indicator (14,22,3) – the histogram and the signal line – is a supporting indicator that can also be used as a source of signals.
Important speeches and reports (always included in the news calendar) can significantly affect the movement of the currency pair. Therefore, during their release, trading should be done with utmost caution, or traders should exit the market to avoid sharp price reversals against the previous movement.
Beginning traders in the forex market should remember that not every trade can be profitable. Developing a clear strategy and effective money management are the keys to long-term trading success.


