
यह भी देखें


 12.08.2026 01:43 PM
The EUR/USD pair is consolidating ahead of the key resistance levels represented by the 200-day EMA and 100-day SMA, which are located close to each other, while remaining within the familiar range that has held throughout the past week. Traders are eagerly awaiting the release of key US inflation data and further developments related to the Middle East crisis before making new directional trading decisions.
Today, US Consumer Price Index (CPI) data are scheduled for release, while the Producer Price Index (PPI) will be released on Thursday. These reports could provide new clues about the future policy of the US Federal Reserve (Fed). The data will have a significant impact on short-term demand for the US dollar and, consequently, affect the dynamics of the EUR/USD pair. At the same time, concerns about rising inflation driven by higher oil prices are increasing the likelihood of Fed interest rate hikes, which supports the dollar and limits the pair's upside.
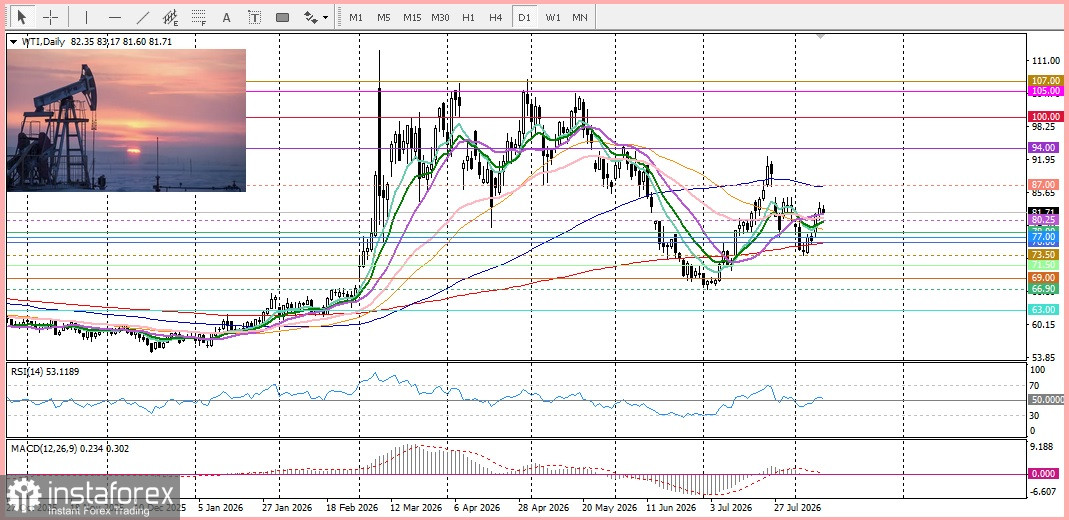
On Tuesday, oil prices reached a one-and-a-half-week high after Mojtaba Khamenei, an adviser to Iran's Supreme Leader, stated that the Strait of Hormuz would not be reopened until the United States met Tehran's demands.
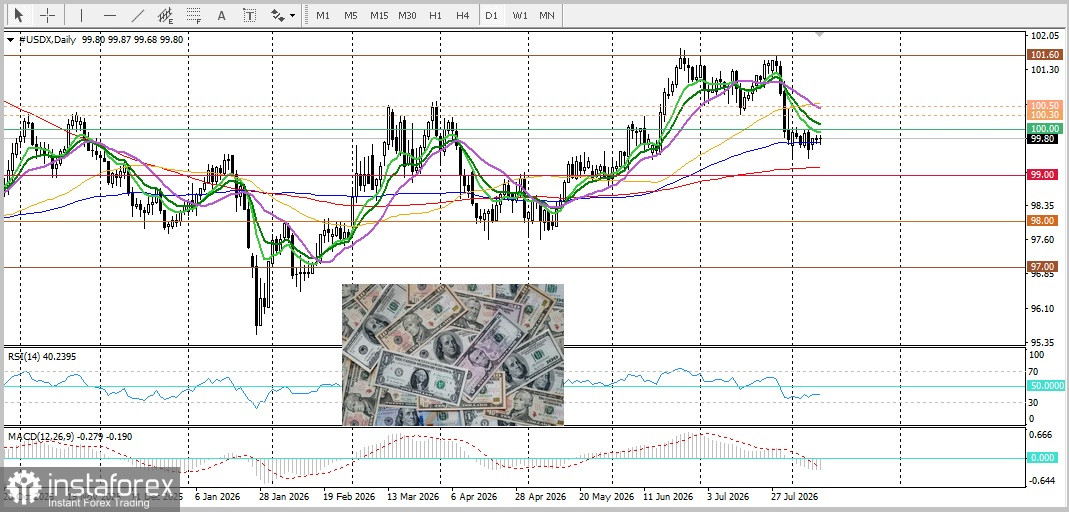
In addition, Iran-backed Houthi forces in Yemen have increased attacks on vessels in the Red Sea and the Bab el-Mandeb Strait, targeting vessels linked to Saudi Arabia. This has led to higher oil prices and strengthened the US dollar as a safe-haven asset.
Investors are concerned that rising energy prices could once again intensify inflationary pressures and force major central banks, including the Fed, to adopt a more hawkish stance. According to CME Group's FedWatch Tool, traders are pricing in a high probability that the US central bank will raise borrowing costs by the end of this year. Expectations remain supportive of higher US Treasury yields, which supports dollar bulls and limits significant upside in EUR/USD.
From a technical perspective, EUR/USD is currently capped by the 100-day simple moving average (SMA) and the 200-day EMA. This suggests that attempts to move higher remain vulnerable as long as these levels continue to limit further upside. On the other hand, initial support is located at the 9-day EMA, followed by the 14-day EMA near 1.1506, below which the round level of 1.1500 lies. If prices continue to decline toward the 20-day SMA, buyers could attempt to stabilize spot prices at this level. The oscillators remain in positive territory, confirming the bulls' advantage in the market.

