
یہ بھی دیکھیں


 02.10.2026 07:44 AM
The 4-hour (H4) chart for Crude Oil (#CL) shows price movements within a clear bearish range. The price is currently trading around the 92.54 level, attempting a short-term recovery and testing key pivot levels to reassess the trend.
Technical Analysis and Price Action
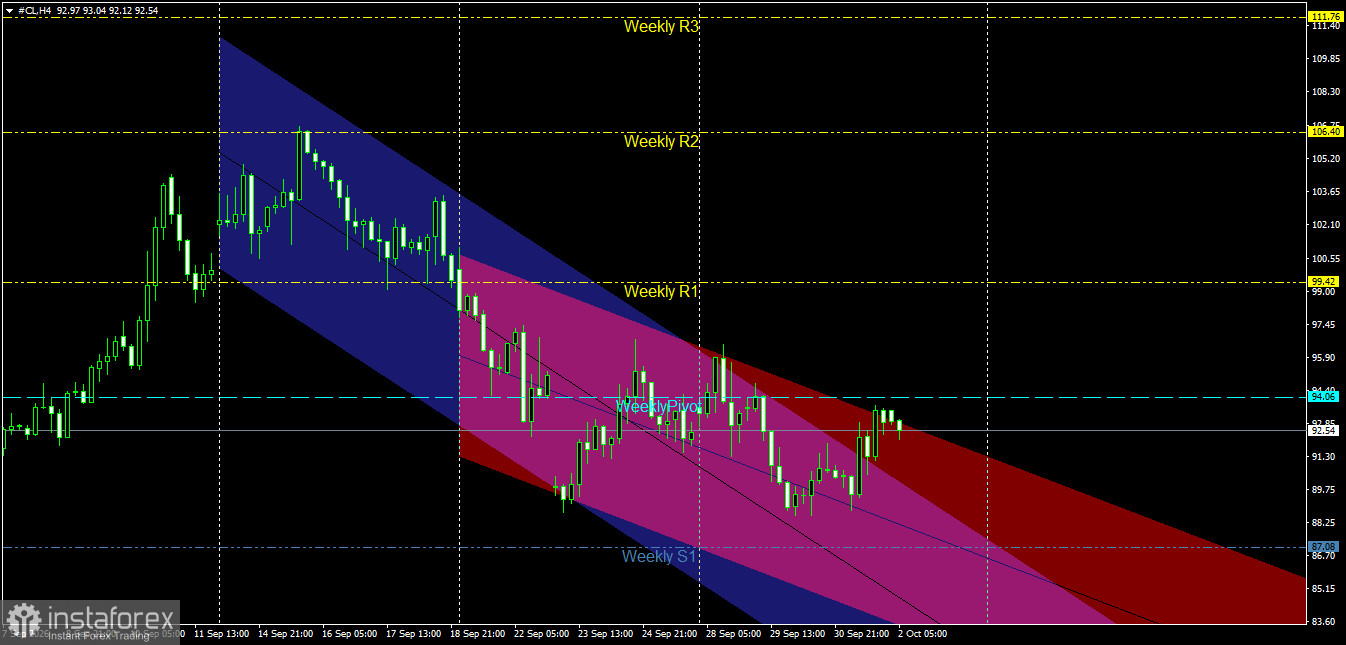
Price Channel Structure: The price is moving within a primary bearish channel (blue), reflecting the overall negative trend that began after hitting a peak near the second weekly resistance level (Weekly R2) at 106.40. Concurrently, an accelerated sub-trend (pink/red) is exerting downward pressure on price action.
Interaction with Pivot Levels: After facing intense selling pressure that broke the first weekly resistance level (Weekly R1) at 99.42, the price fell and broke the weekly pivot point at 94.06. Currently, the price is attempting to rebound from the area near the 89.75 support level to retest the pivot at 94.06, which now acts as a key resistance barrier against further corrective gains.
Key Support and Resistance Levels
Key Resistance Levels:
Resistance 1: 94.06 (Weekly Pivot Point).
Resistance 2: 99.42 (Weekly R1).
Key Resistance: 106.40 (Weekly R2). Key Support Levels:
First Support: 89.75 – 91.30 (near-term intraday lows).
Second Support: 87.08 (Weekly S1).
Key Support: 83.60 – 85.15 (lower boundary of the descending channel).
Price Action Outlook and Trading Recommendations
Bearish Scenario (Primary):
The bearish scenario remains the most likely as long as the price trades below the weekly pivot point of 94.06 and within the descending channel.
Recommendation: Sell upon a retest of the 94.06 level where resistance holds, or upon a break below the intraday low of 91.30.
Technical Targets: Target 89.75 as the first objective, followed by an extension toward the first weekly support at 87.08.
Stop Loss: A 4-hour candle close above 95.90.
Bullish Corrective Scenario (Alternative):
Triggered if the price breaks above the weekly pivot point of 94.06 and stabilizes there with a strong 4-hour candle.
Confirmation Condition: Breaking 94.06 and holding above it.
Technical Targets: Initiation of a bullish corrective wave targeting 97.45, extending to the first weekly resistance at 99.42. Risk Management
Trading crude oil requires strict adherence to stop-loss orders, given the sensitivity of energy prices to geopolitical and economic changes, while keeping the risk level within a range of 1% to 2% of total capital.
The H1 chart for Crude Oil (#CL) shows ongoing bullish recovery attempts following a previous decline. The price is currently trading at the 92.47 level, holding within a bullish range aimed at retesting key resistance zones.
Technical Analysis and Price Action
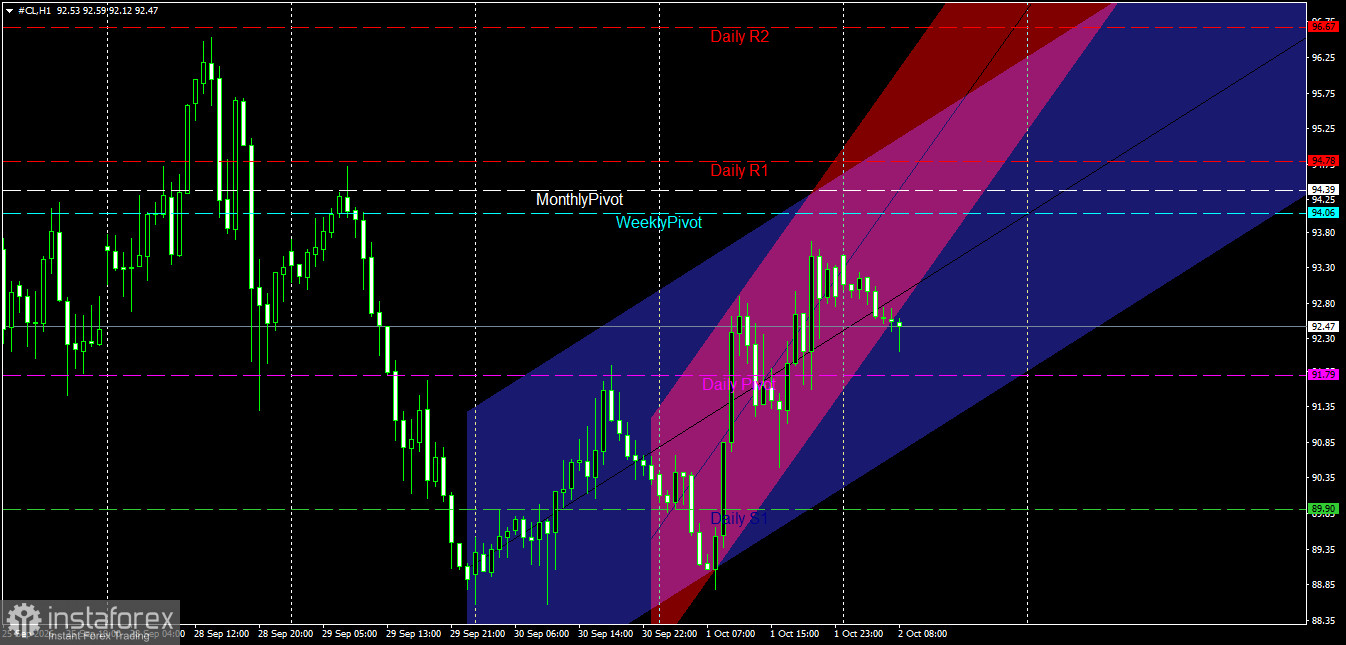
Price Channel Structure: The price is moving within a primary bullish channel (blue) that reflects the start of a short-term positive trend originating from the 88.35 low. Overlapping this is an accelerated sub-trend (pink/red), during which the price surged toward the 93.80 level before entering a sideways corrective phase and attempting to gather new momentum near the channel's midline.
Interaction with Pivot Levels: The price successfully rebounded strongly above the first daily support level (Daily S1) at 89.90 and managed to break above—and stabilize over—the daily pivot point (Daily Pivot) at 91.79. The price is now positioning itself to test a combined resistance zone comprising the weekly pivot point (Weekly Pivot) at 94.06 and the monthly pivot point (Monthly Pivot) at 94.39.
Key Support and Resistance Levels
Key Resistance Levels:
First Resistance: 94.06 – 94.39 (Weekly Pivot and Monthly Pivot).
Second Resistance: 94.78 (First Daily Resistance Level - Daily R1). Key Resistance: Level 96.67 (Daily R2).
Key Support Levels:
First Support: Level 91.79 (Daily Pivot).
Second Support: Level 89.90 (Daily S1).
Main Support: Level 88.35 (Lower boundary of the main ascending channel).
Price Action Outlook and Trading Recommendations
Bullish Scenario (Primary):
The positive scenario is the most likely in the short term, provided the price remains above the Daily Pivot (91.79) and continues trading within the lower boundaries of the blue channel.
Recommendation: Buy if the price holds above 91.79 or upon a retest of the ascending channel's midline.
Technical Targets: Target the 94.06–94.39 zone as a first objective; a breakout here opens the way to 94.78, followed by the second daily resistance at 96.67.
Stop Loss: A one-hour candle close below 91.35.
Bearish Corrective Scenario (Alternative):
This scenario is triggered if the price breaks the Daily Pivot (91.79) and stabilizes below it with a strong one-hour candle.
Condition: Break below 91.79 and close beneath it.
Technical Targets: A return of selling pressure targeting the first daily support level at 89.90. Risk Management
Trading crude oil requires strict adherence to risk management rules and the precise setting of stop-loss orders to withstand intraday volatility, while keeping the risk per trade within 1% to 2% of the capital.


