
یہ بھی دیکھیں


 04.08.2026 04:13 AM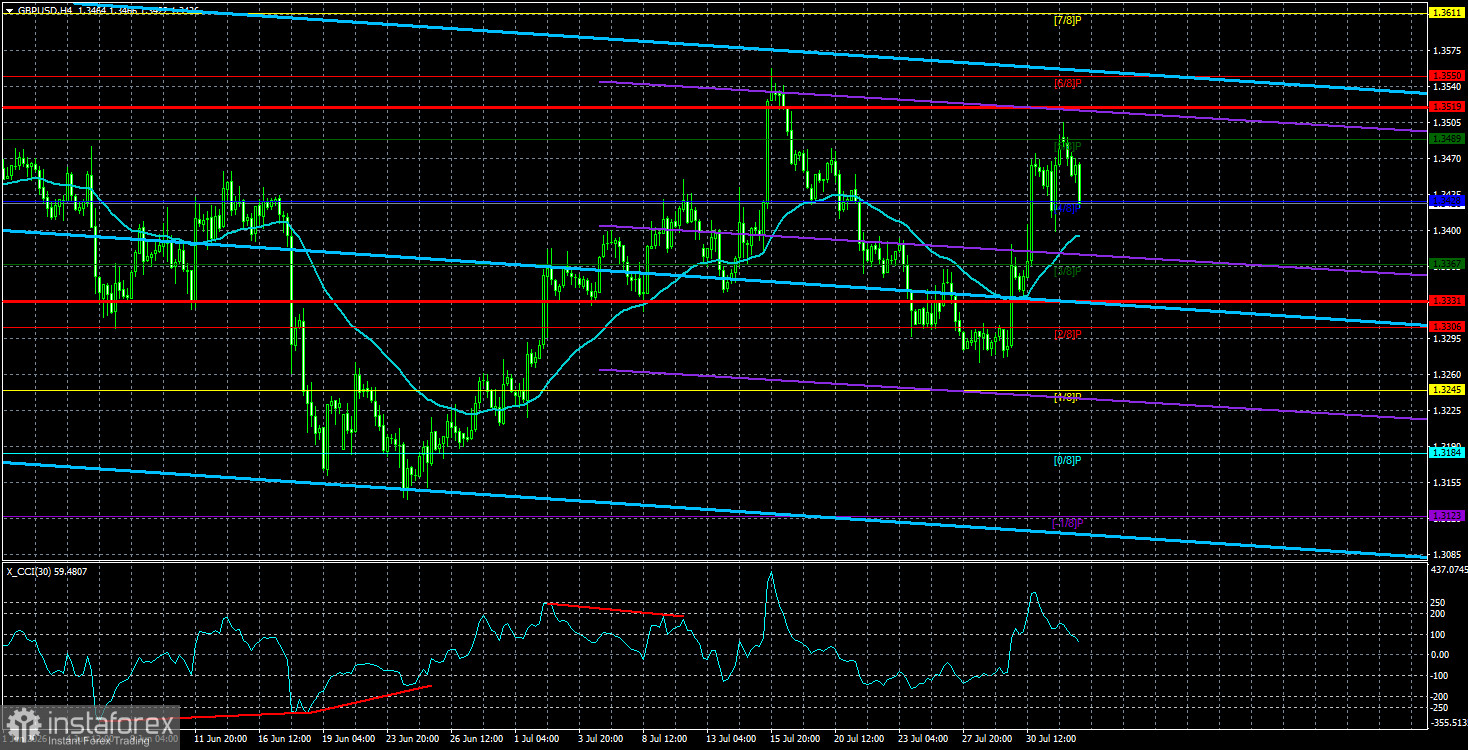
The GBP/USD currency pair traded fairly calmly on Monday, though volatility spiked in the afternoon, mainly due to the ISM Manufacturing Index in the United States. However, we will discuss macroeconomic data later. In this article, we would like to review the most important events of the current week, of which there will be many.
If we list all the events, the list will be impressive. However, it doesn't make sense to enumerate all events. Yes, the ISM Manufacturing Index, the JOLTs report, the ADP report, and even the unemployment rate are all important data that can and should provoke a market reaction in the event of a discrepancy between expectations and actual values. But the dollar's future now depends solely on two indicators: NonFarm Payrolls and the inflation rate.
Inflation is relatively straightforward. The higher it is, the more likely we are to see the Federal Reserve tighten monetary policy. Since the market prioritizes the Fed among central banks, there is no doubt that the Fed's monetary policy and interest rate decisions will be of paramount importance. However, inflation in the U.S. is already quite high, and the Fed, led by Trump's protege Kevin Warsh, is in no hurry to raise the key rate. Why?
There could be several reasons. First, it should be remembered that Warsh was appointed by Trump to lower the Fed's key rate, not to raise it. Of course, Warsh cannot make the rate decision alone, but he is the head of the Fed. We do not doubt that he has some influence on the Committee. Second, the Monetary Committee may be concerned about the labor market. If the labor market contracts again, it would be a compelling reason not to raise the key rate and to look away from the Consumer Price Index. Let us remind you that last year, the Fed carried out three policy-tightening measures, as the labor market was creating so many jobs that people wanted to cry.
Thus, this week's NonFarm Payrolls report will be key. According to forecasts, between 79,000 and 83,000 jobs were created in July. It is worth reminding that any predictions are merely formalities. The actual figure could easily be around 200,000 or even negative. Therefore, one should not rely solely on predictions. However, trends can be relied upon, as that is what trends are for.
In March 2026, the number of NonFarm jobs was 214,000, and now this figure looks like an exception to the rules. By April, only 148,000 jobs were created; in May, 129,000; and in June, the figure dropped to 57,000. It can be assumed that the war in Iran and rising energy prices have negatively affected the American economy. Recall that GDP in the second quarter fell to 1.5% against much higher forecasts. Therefore, the American economy is responding to the conflict in the Middle East, and NonFarm Payroll reports may continue to disappoint. In this case, the Fed will not tighten monetary policy in September, depriving the dollar of another growth factor.
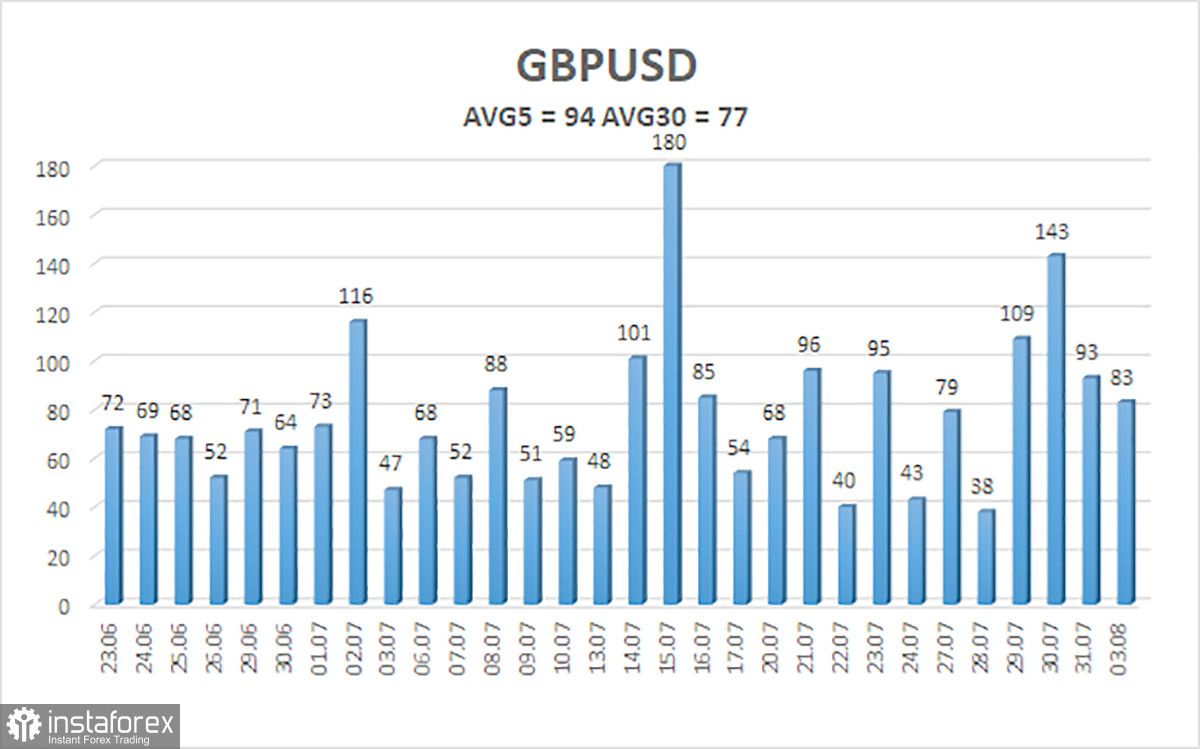
The average volatility of the GBP/USD pair over the last 5 trading days stands at 94 pips. For the pound/dollar pair, this value is considered "average." Thus, on Tuesday, August 4, we expect movement within a range bounded by 1.3331 and 1.3519. The upper linear regression channel is directed downward, indicating a bearish trend. The CCI indicator has entered the overbought territory twice, which may provoke a new downward correction.
S1 – 1.3428
S2 – 1.3367
S3 – 1.3306
R1 – 1.3489
R2 – 1.3550
R3 – 1.3611
The GBP/USD currency pair maintains an upward trend. Trump's policies will continue to pressure the U.S. economy; therefore, we do not expect growth in the U.S. dollar in the long term. The year 2026 is turning out to be super-positive for the dollar due to geopolitics, but every fairy tale comes to an end. The weekly timeframe shows a range between 1.3150 and 1.3780 within a four-year upward trend, supporting expectations of continued growth in the British currency in the medium term. Long positions with targets of 1.3519 and 1.3550 can be considered when the price is above the moving average. When the price is below the moving average line, short trades can be considered with targets of 1.3331 and 1.3306.


