
यह भी देखें


 02.10.2026 04:28 AM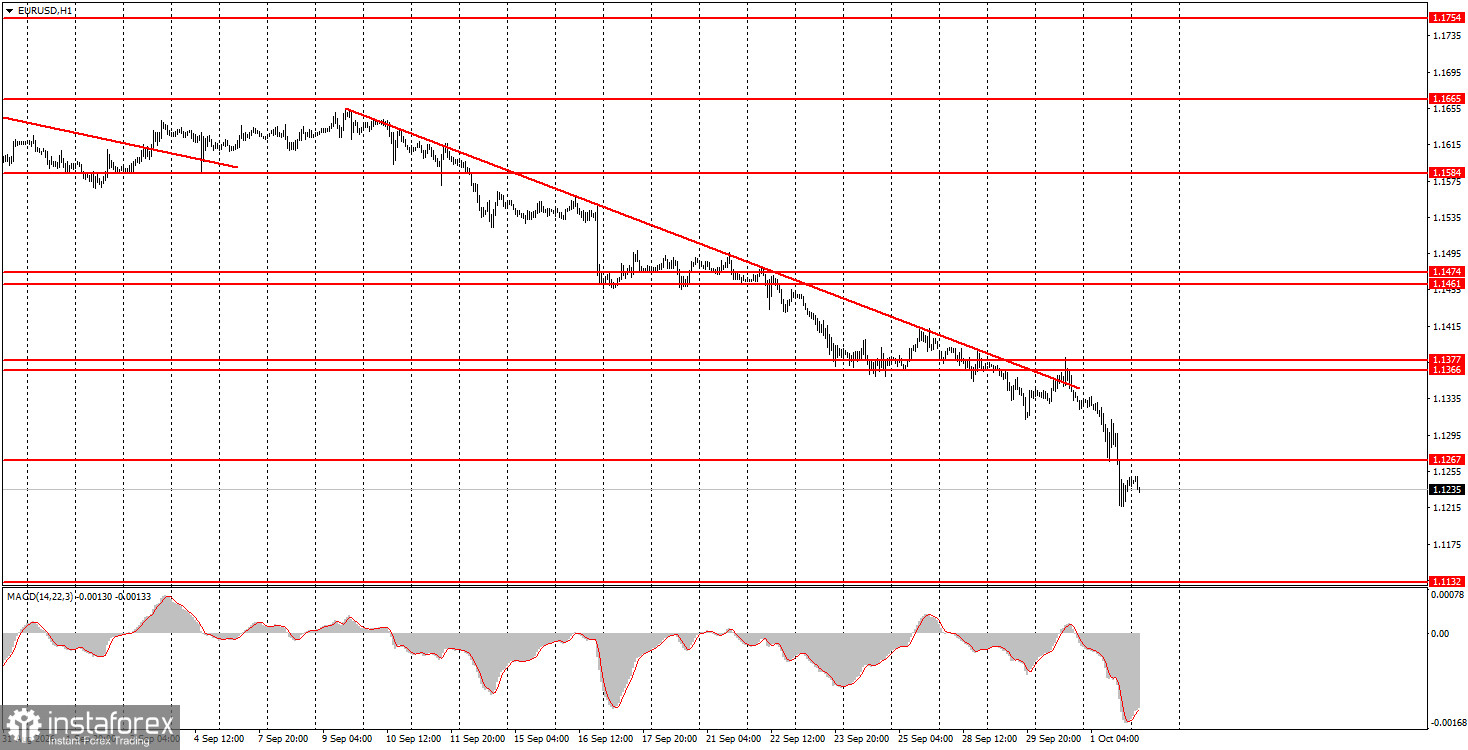
The EUR/USD currency pair continued its downward movement on Thursday—the fourth week in a row. In principle, we have said many times that the dollar's rise is no longer related to Federal Reserve monetary policy and market expectations, since even the "hawkish" mood has eased a bit recently. Likewise, macroeconomic data or geopolitics are not to blame for the euro's fall. A report or any event in the Middle East can provoke a move within a single day, but not every day for the fourth week in a row. Thus the situation is simply what we said: the US dollar is rising because it is being bought, and it is being bought because it is rising—an inertial, technical movement. The dollar remains the world's number-one currency, so capital outflows from any market (for example, the bond market) automatically increase demand for liquidity. Liquidity falls, a shortage appears, and rates rise. And bond markets are falling now not only in the US but also in the Eurozone and the UK.
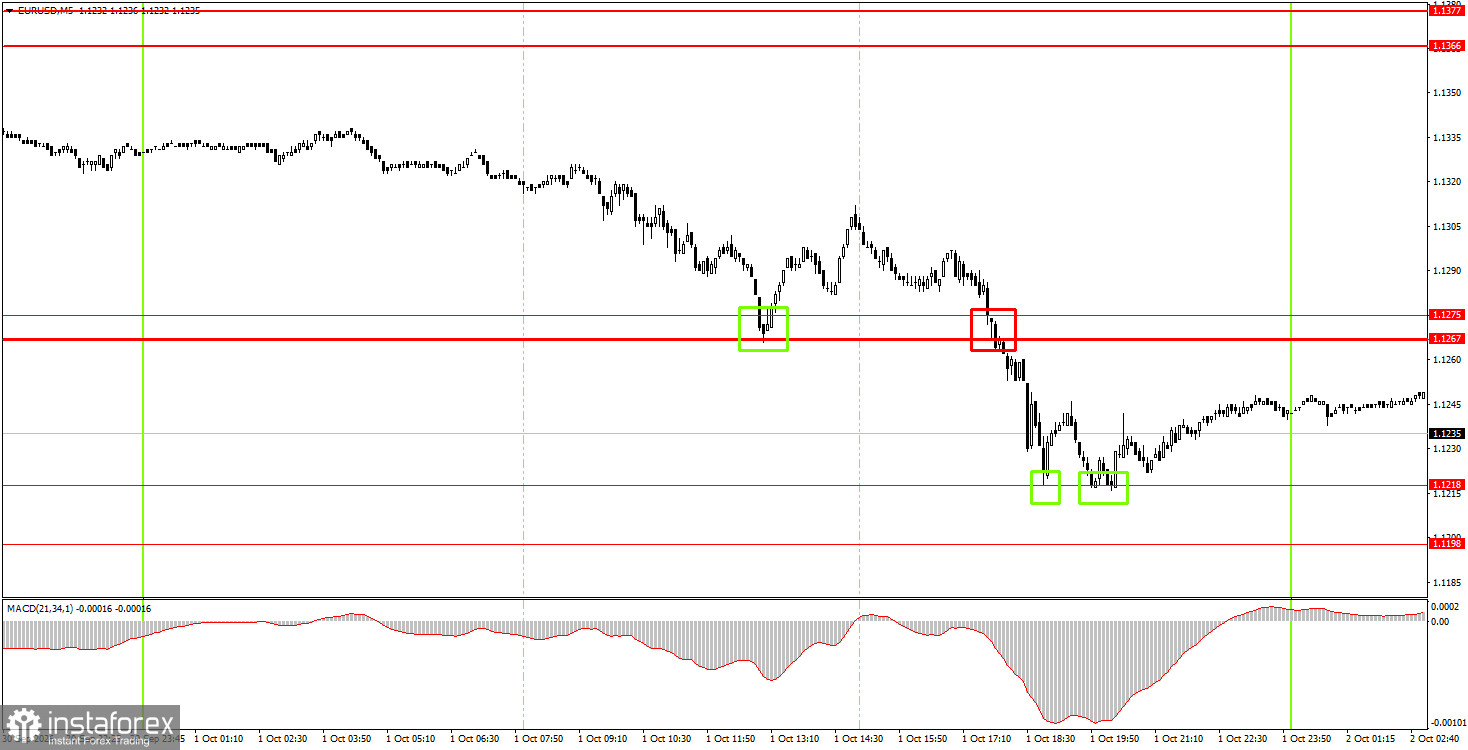
On the 5-minute TF on Thursday, several trading signals were formed. However, the first signal formed on Wednesday around the 1.1366–1.1377 area. Thanks to that signal, traders could profit from the rally to the 1.1267–1.1275 area. A bounce from the 1.1267–1.1275 area allowed opening long positions, but those trades closed at breakeven by stop-loss. A new sell signal allowed us to a little more profit as price slipped to the 1.1198–1.1218 area. A bounce from that last area again allowed us to open longs.
On the hourly timeframe, EUR/USD continues the downward trend, which is now a full-fledged trend. Given recent events, we do not expect the European currency to plummet like a stone. But the market continues to buy the US dollar, ignoring any events and publications.
On Thursday, novice traders can consider new short positions on a rebound from the 1.1267–1.1275 area or on consolidation below the 1.1198–1.1218 area. Open longs on a bounce from the 1.1198–1.1218 area.
On the 5-minute TF consider the levels 1.1132–1.1140, 1.1198–1.1218, 1.1267–1.1275, 1.1366–1.1377, 1.1461–1.1474, 1.1527–1.1531, 1.1584–1.1594, 1.1655–1.1665. On Friday, the US will publish Nonfarm Payrolls and the unemployment rate, and the Eurozone will add an inflation report as a bonus. So today we are in for another crazy day.
Price levels (areas) of support and resistance serve as targets for opening buy or sell trades or as sources of signals.
Red lines indicate channels or trend lines that show the current trend and the preferred trading direction.
The MACD indicator (14,22,3) — the histogram and signal line — is an auxiliary indicator that can also provide signals.
Important speeches and reports (listed in the news calendar) can significantly influence currency pair movements. Therefore, during their release, traders should approach trading with utmost caution, or exit the market to avoid sudden reversals against the preceding move.
Beginner forex traders should remember that not every trade can be profitable. Developing a clear strategy and practicing money management are key to long-term success in trading.

