
Lihat juga


 19.10.2026 11:08 AM
Analysis:
Within the dominant bearish trend in the euro chart, a countertrend wave has been developing since the beginning of October. It remains within the boundaries of a corrective structure. The wave is taking the form of an extended flat and is not yet complete at the time of analysis. An intermediate retracement is developing within the final part of wave (C). The price has rebounded from strong resistance.
Forecast:
During the coming week, following a period of sideways trading, the overall upward movement is expected to resume. A short-term decline is possible in the first few days. Pressure on the lower boundary of the support zone cannot be ruled out. Afterward, a reversal may develop, allowing the euro to resume its upward trajectory.
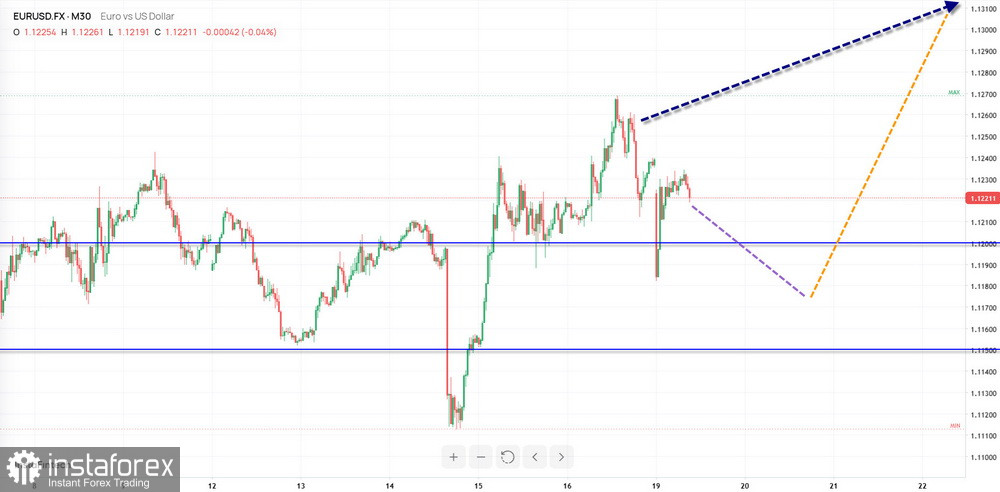
Potential Reversal Zones
Resistance:
- 1.1360/1.1410
Support:
- 1.1200/1.1150
Recommendations:
Buying: Long positions may become possible once appropriate signals appear near the support zone on the trading systems you use.
Selling: The downward potential is limited, and the risk is high.
Analysis:
The pair's dominant upward extended flat, which has been developing since the beginning of August, has brought the price into an area where potential reversal zones of different time frames converge. Wave structure analysis indicates that an upward segment with reversal potential has been developing in recent weeks. The price is confined between strong levels in opposing directions.
Forecast:
During the coming week, sideways trading is expected to continue, with the price moving within a range between potential reversal zones of different time frames. A decline and movement along the support zone are more likely in the first few days. In the second half of the week, a reversal is expected, accompanied by increased volatility and the beginning of an upward move in the pair.
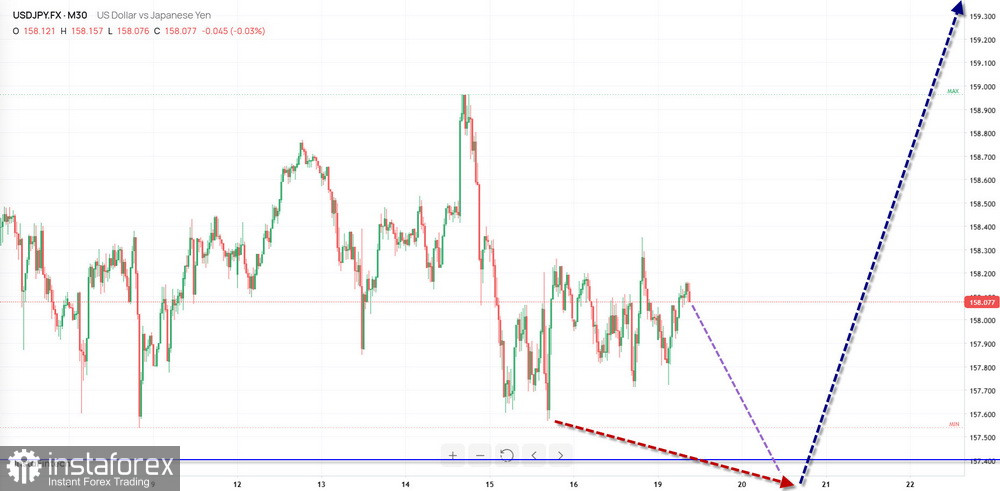
Potential Reversal Zones
Resistance:
- 159.90/160.40
Support:
- 157.40/156.90
Recommendations:
Buying: Long positions may become appropriate once confirmed reversal signals appear near the support zone.
Selling: Current market conditions do not favor short positions in this pair.
Analysis:
The unfinished short-term wave in the GBP/JPY pair began in early August of this year. The wave structure is developing as a running flat. The price has reached the lower boundary of a strong potential reversal zone on the higher time frame. Within the final part of the wave, a flat correction has been developing over the past four weeks and remains incomplete.
Forecast:
During the coming week, the price is expected to continue moving within a range between the nearest opposing zones. A decline toward the boundaries of the support zone is possible in the first few days. A subsequent reversal and upward movement are likely. The price may rise toward the resistance zone.
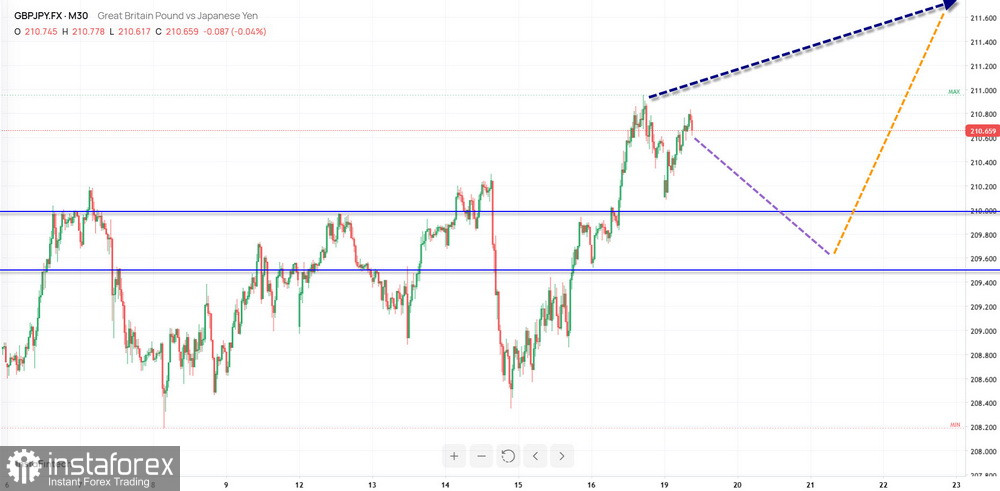
Potential Reversal Zones
Resistance:
- 213.00/213.50
Support:
- 210.00/209.50
Recommendations:
Selling: The downward potential is limited. Short positions may be considered with reduced position sizes for intraday trading.
Buying: Long positions may become appropriate once confirmed reversal signals appear near the support zone on your trading systems.
Analysis:
The short-term price direction of the Canadian dollar has been determined by an upward trend since August of this year. By early October, the price had reached the lower boundary of a potential reversal zone on the higher time frame. Since mid-October, the price has been developing a corrective segment that remains incomplete. The price is approaching another potential reversal zone on the hourly time frame.
Forecast:
At the beginning of the coming week, sideways trading is expected to continue. A decline is possible, with the price moving along the support level. A subsequent reversal is expected, followed by a resumption of the pair's upward movement. The price may rise as far as the boundaries of the projected resistance zone.
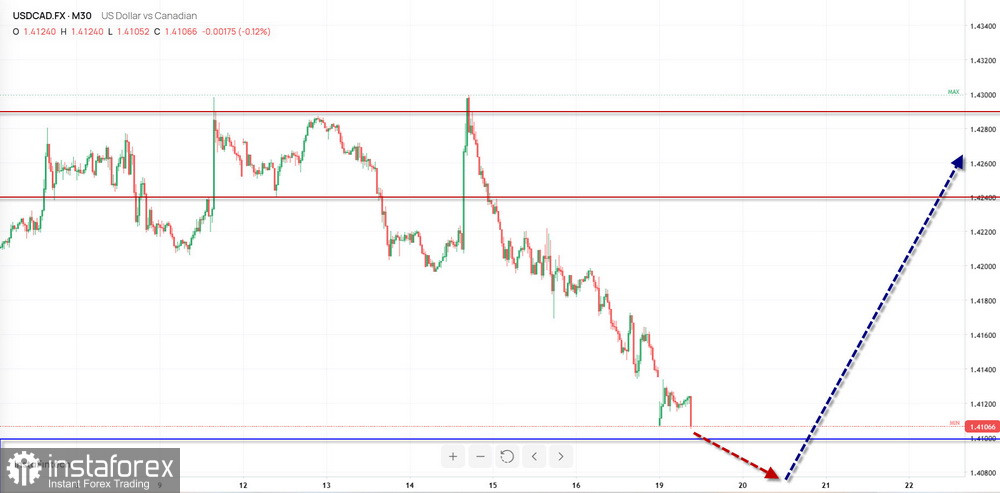
Potential Reversal Zones
Resistance:
- 1.4240/1.4290
Support:
- 1.4100/1.4050
Recommendations:
Buying: Long positions may become appropriate once reversal signals appear near the support zone on your trading systems.
Selling: Short positions may be risky and have limited potential.
Brief Analysis:
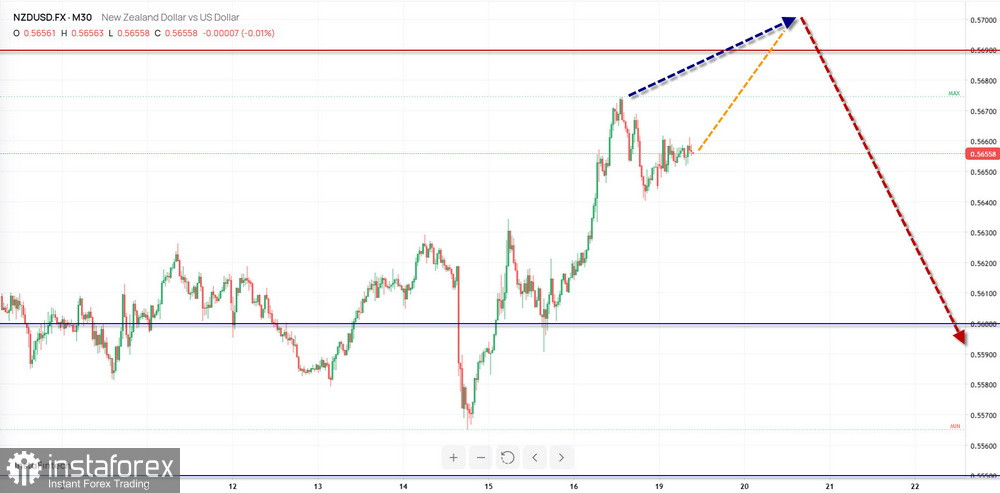
Since August of this year, a downward wave on the daily time frame has been pushing the New Zealand dollar major pair lower. The current unfinished segment began in early October and is forming a countertrend correction. After breaking through another strong resistance level during the past week, the price has formed an intermediate sideways retracement that remains incomplete.
Weekly Forecast:
At the beginning of the coming week, the New Zealand dollar is expected to continue moving sideways overall. The price may rise toward the resistance zone. A subsequent reversal is likely, and the price may decline toward the boundaries of the support zone.
Potential Reversal Zones
Resistance:
- 0.5690/0.5740
Support:
- 0.5600/0.5550
Recommendations:
Buying: Long positions may be considered in smaller increments for intraday trading.
Selling: Short positions may become appropriate once corresponding signals appear within the reversal zone on your trading systems.
Analysis:
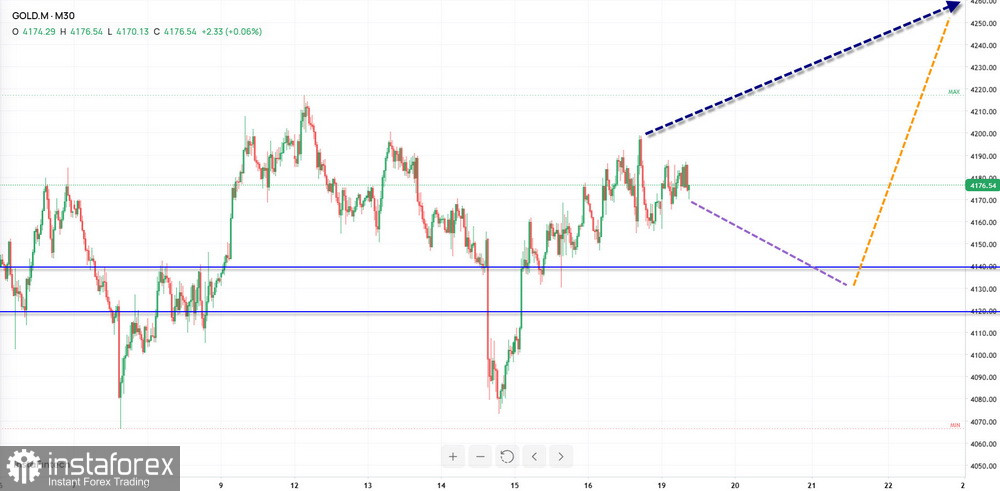
The short-term price trend in gold has been determined by a downward wave over the past two months. Since late September, an unfinished correction of the main trend has been developing in the opposite direction. In recent weeks, the price has been moving along the upper boundary of a potential reversal zone on the daily chart. The upward segment that began on October 14 has reversal potential.
Forecast:
During the coming week, sideways price movement is expected to continue overall. In the first few days, the most likely scenario is continued sideways trading along the projected support level. A reversal may then develop, allowing the upward movement to resume. The potential weekly advance is limited by the projected resistance zone.
Potential Reversal Zones
Resistance:
- 4290.0/4310.0
Support:
- 4140.0/4120.0
Recommendations:
Selling: The downward potential is limited, and short positions may be risky.
Buying: Long positions may become possible once confirmed reversal signals appear on the trading systems you use.
Explanatory Notes: In simplified wave analysis (SWA), all waves consist of three parts (A-B-C). The latest unfinished wave is analyzed on each time frame. Dashed lines indicate expected price movements.
Important: The wave algorithm does not take into account the duration of price movements over time.


