
یہ بھی دیکھیں


 02.10.2026 05:37 AM
Bitcoin ended a local flat and broke out into the open. However, there is still no confidence that the leading cryptocurrency will continue to rise. The current rise on the daily TF still looks like an unfounded pump or manipulation by large players aimed at pushing as many traders as possible into long positions, only to then crash the price. Essentially, price has left the sideways channel, but this breakout may still be an abnormal, deep deviation. Therefore, we still consider the probability of a new fall to the lower boundary of the sideways channel higher than that of further growth.
At the same time, one cannot ignore a global redistribution of liquidity between markets. Recall that government bond yields are breaking records in the US, the Eurozone and the UK. This factor means demand for these bonds is extremely low, and governments must offer higher yields to attract investors. Since demand in the bond market is currently low while the dollar is rising strongly, it is reasonable to assume capital is leaving bonds and flowing into fiat. From fiat, the freed funds could flow into the crypto market. Thus,, one cannot completely rule out a new surge in Bitcoin, but it would be driven by liquidity inflows rather than specific fundamentals.
In short, investors now have growing amounts of free capital that needs to be allocated. Bitcoin is not the only investment destination, but it is one of them. Even if part of that capital pours into crypto, it will significantly lift both Ether and Bitcoin. And despite Federal Reserve monetary tightening, the prices of the two leading cryptocurrencies may continue to rise.
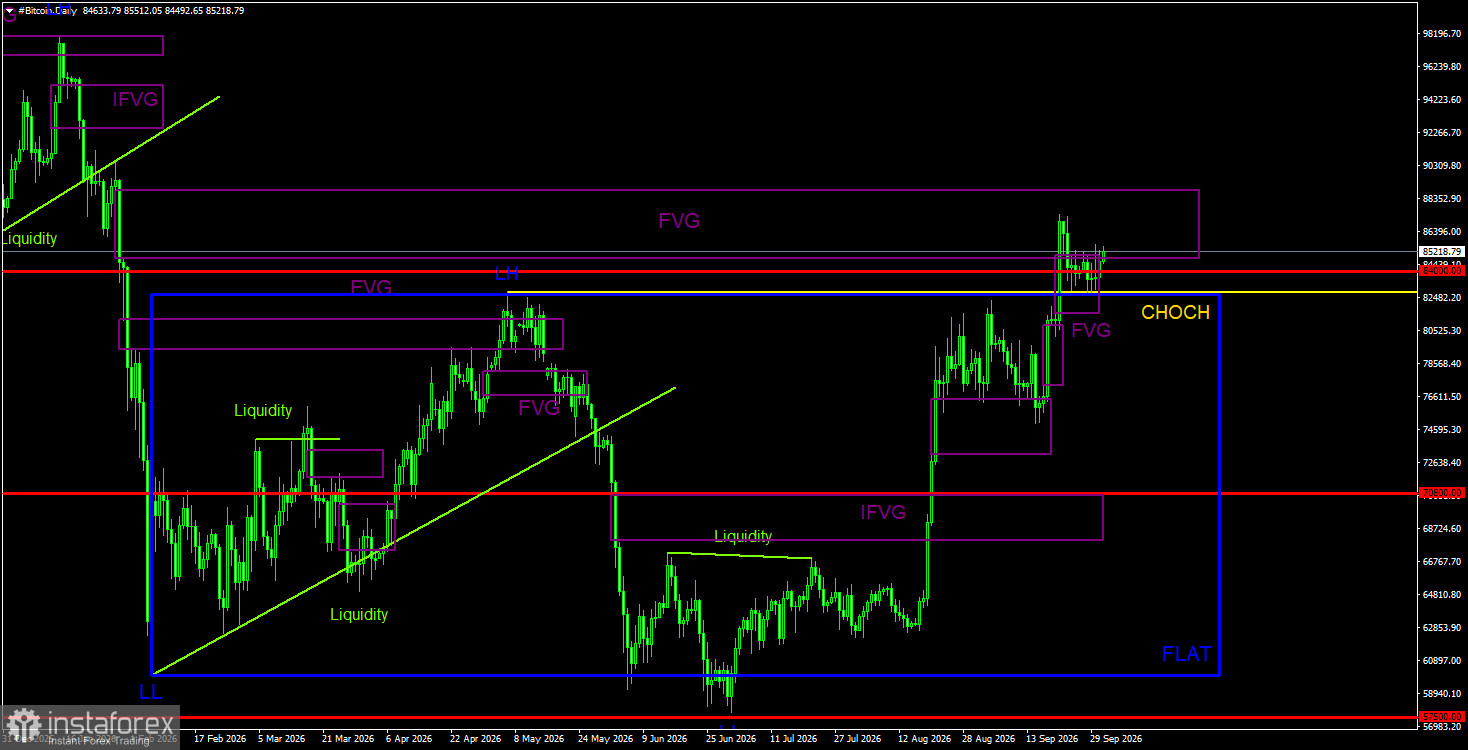
On the daily TF, the downtrend structure is broken, so "digital gold" has most likely moved into a new bull trend. At the moment, the price has filled the previous trend's bearish FVG, so we expect a downward correction. We note that the latest Bitcoin rise, like the mid-August rise, shows all the signs of a pump. The breakout from the sideways channel $60,000–$82,500 may still be a deviation. Support comes from a bullish FVG in the $81,500–$89,000 range; however, so far there has been no reaction to this pattern. Bitcoin is increasingly approaching a correction.
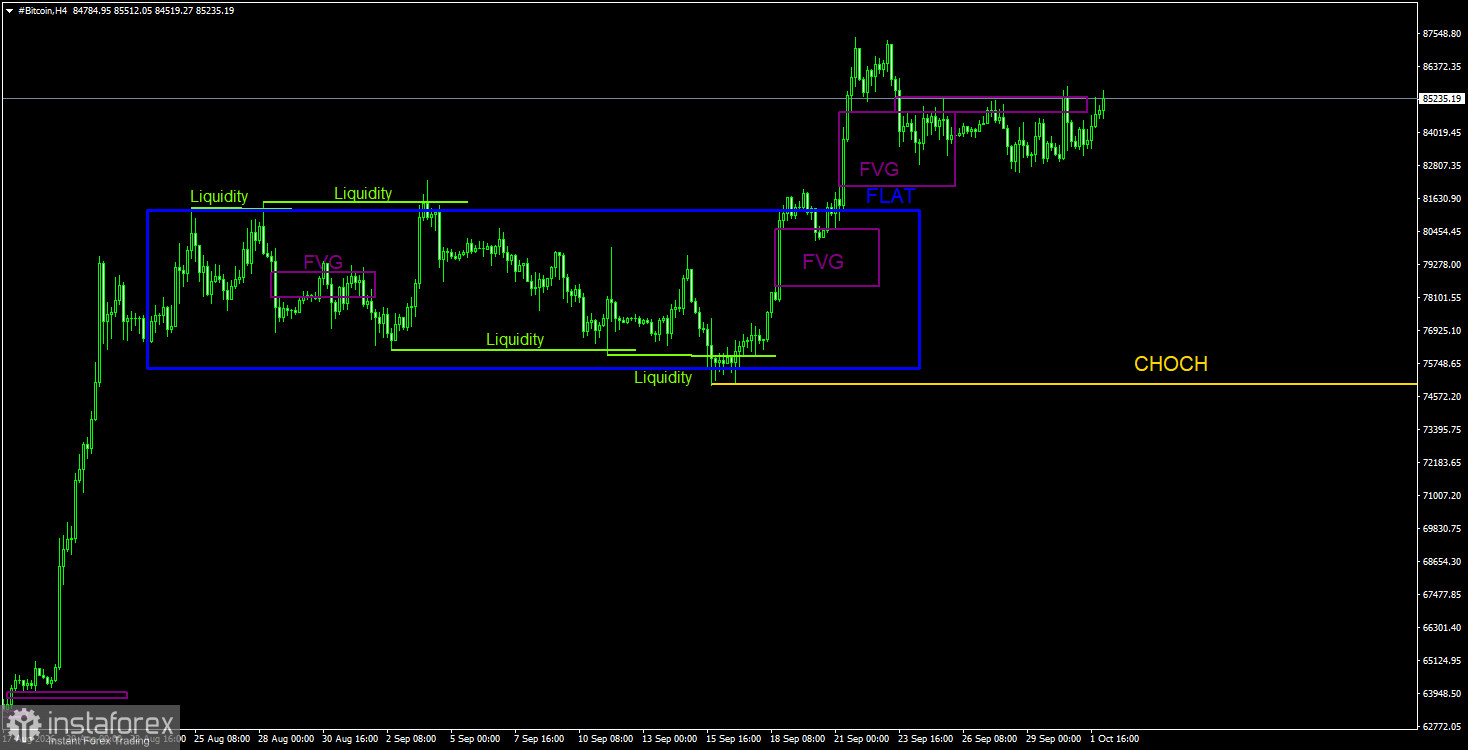
On the 4-hour timeframe, Bitcoin left the bounds of the sideways channel. Within that channel, four deviations formed, with the last two being "bullish." Thus, traders could have played the final move from the lower boundary of the channel to the upper one, and now it can be said that the flat is over. From the nearest areas of interest, we can highlight only the last bullish FVG; however, there was no reaction to it. A bearish FVG was also formed, and the reaction to it was very weak. At present, one should be extremely cautious with any positions, because the pump may continue and, given a very thin market, a crash cannot be ruled out.
Bitcoin shows all the signs of the start of a new "bull" trend. This trend begins, as usual, with a pump that has no concrete or clear reasons. The Fed has not started cutting rates, and the Clarity Act bill has not passed yet. In the near term, on the daily TF, Bitcoin may decline, since the price reacted to the "bearish" FVG. We also draw traders' attention to the fact that the current breakout from the sideways channel on the daily chart may be a deviation — yes, a deep deviation, but still a deviation. If so, Bitcoin can still drop back to 57,500$. On the 4-hour TF, one can locally consider both long and short positions, but the last relevant pattern is bearish.


