Veja também

 15.12.2025 03:00 AM
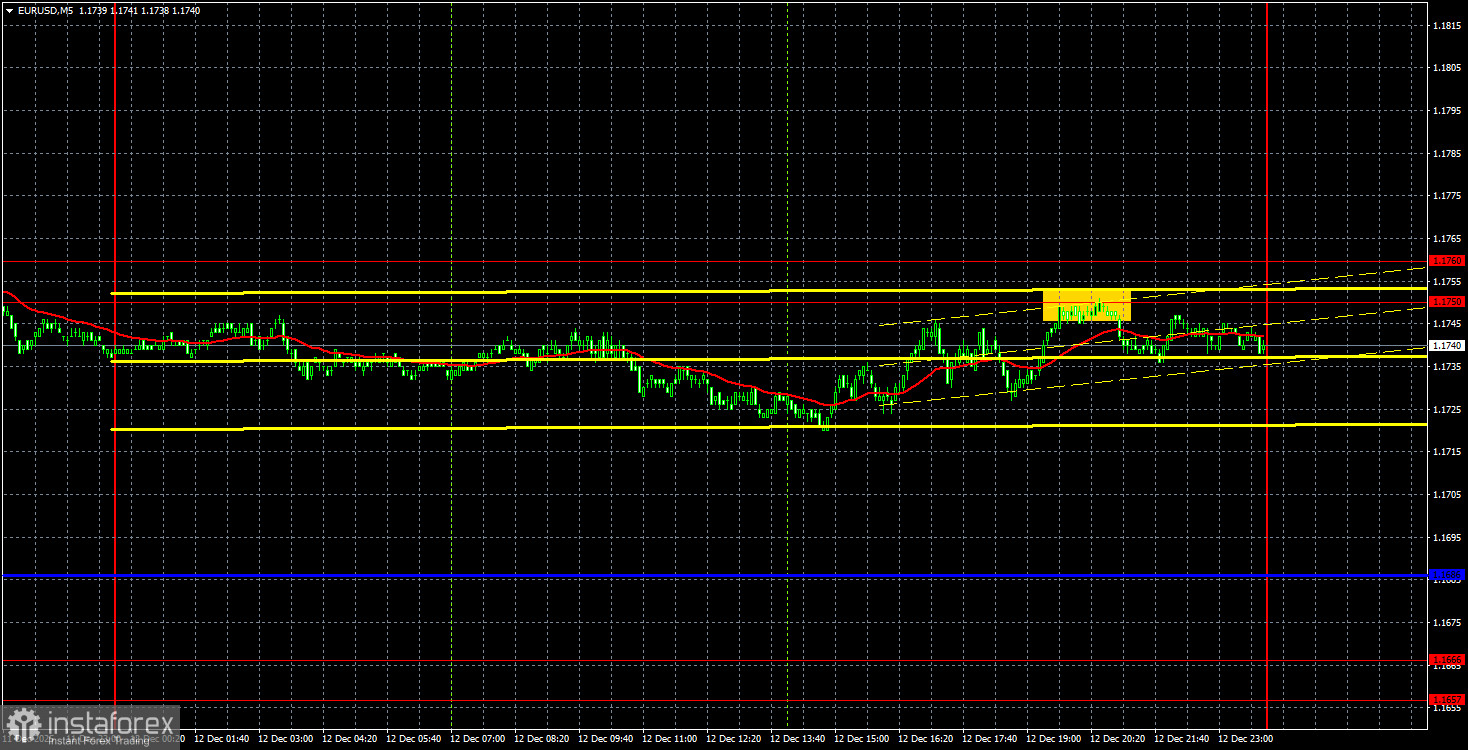
The EUR/USD currency pair showed no notable movements on Friday, with overall volatility for the day at just 31 pips. The only macroeconomic event of note on Friday was German inflation, but we had already warned that market reactions to the report could be minimal. The reason is that inflation in many countries is published in two estimates. The market reacts to the first, while the second rarely differs from the first and is typically ignored. Thus, it can be concluded that there were no significant events on Friday, and the pair's movement throughout the day fully aligned with the fundamental and macroeconomic backdrop.
From a technical standpoint, the hourly timeframe continues to show an upward trend, but the pair failed to overcome the 1.1750-1.1760 area on its first attempt. Recall that we had predicted the euro would reach at least 1.1800 when the price was around 1.1500. The pair has been within the sideways channel of 1.1400-1.1830 for six months on the daily timeframe, so after the rebound near the lower boundary of the range, growth towards the upper boundary was reasonably expected. If the area of 1.1750-1.1760 is surpassed, growth will continue towards 1.1800-1.1830. If this area fails to hold, the upward trend of 2025 will resume.
On the 5-minute timeframe, no trading signals were formed on Friday. Therefore, there were no grounds for traders to open positions. This turned out to be for the best, as there were no movements during the day.
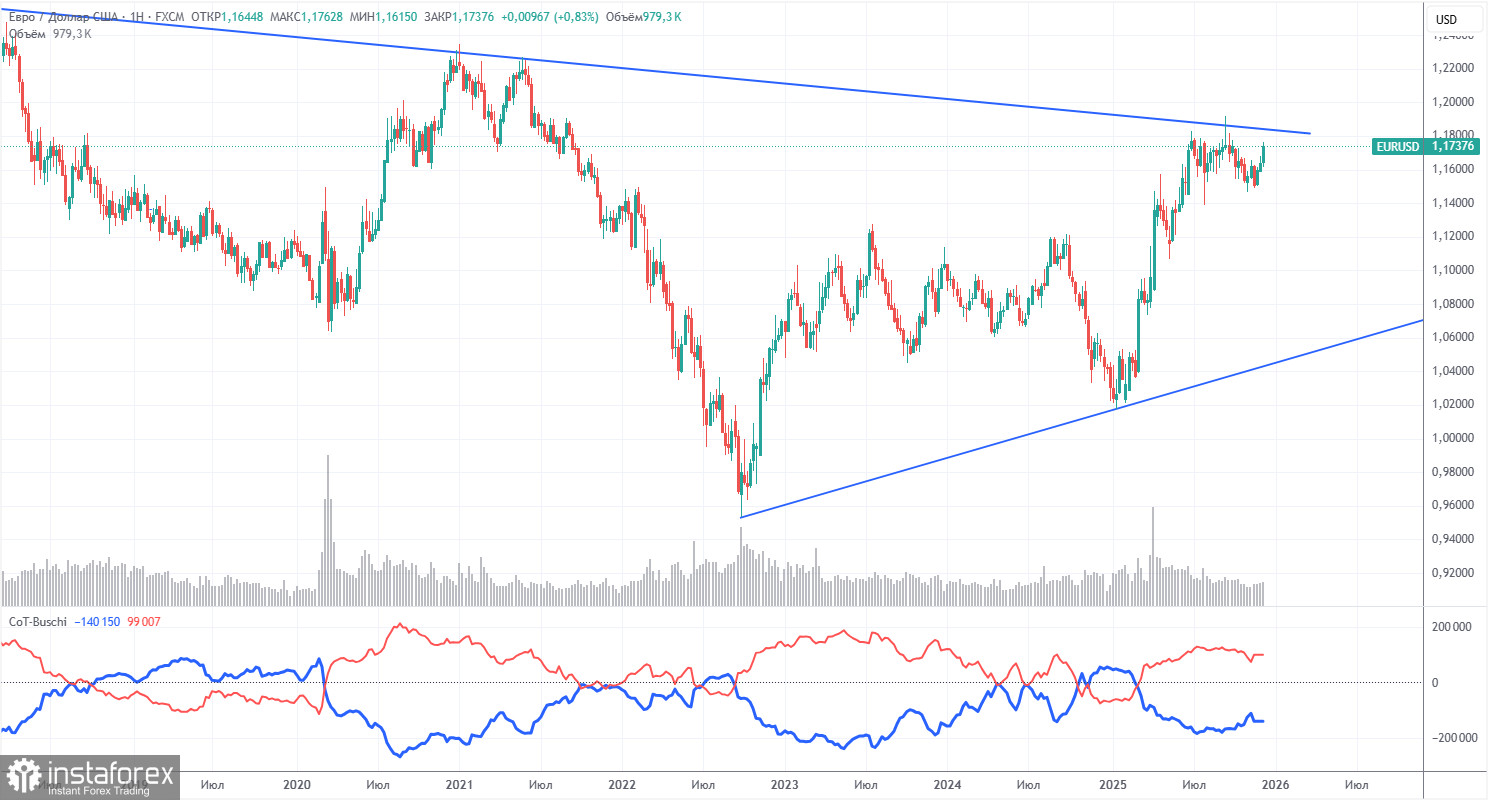
The latest COT report was released last week and is dated November 18. Thus, it is still outdated. The illustration above clearly shows that the net position of non-commercial traders has long been "bullish," with bears struggling to move into their own zone of superiority at the end of 2024 but quickly losing it. Since Trump took office as president of the United States for the second time, only the dollar has been declining. We cannot say with 100% certainty that the decline of the American currency will continue, but current global developments suggest this possibility.
We still do not see any fundamental factors that would strengthen the European currency, while there are enough factors that would weaken the American one. The global downward trend remains in place, but what does it matter where the price has moved in the last 17 years? The dollar could rise if the global fundamental picture changes, but there are currently no signs of that.
The placement of the red and blue lines of the indicator continues to indicate a sustained "bullish" trend. During the last reporting week, the number of longs in the "Non-commercial" group increased by 8,000, while the number of shorts decreased by 17,400. Consequently, the net position grew by 25,400 contracts over the week. However, this data is still outdated and holds no significance.
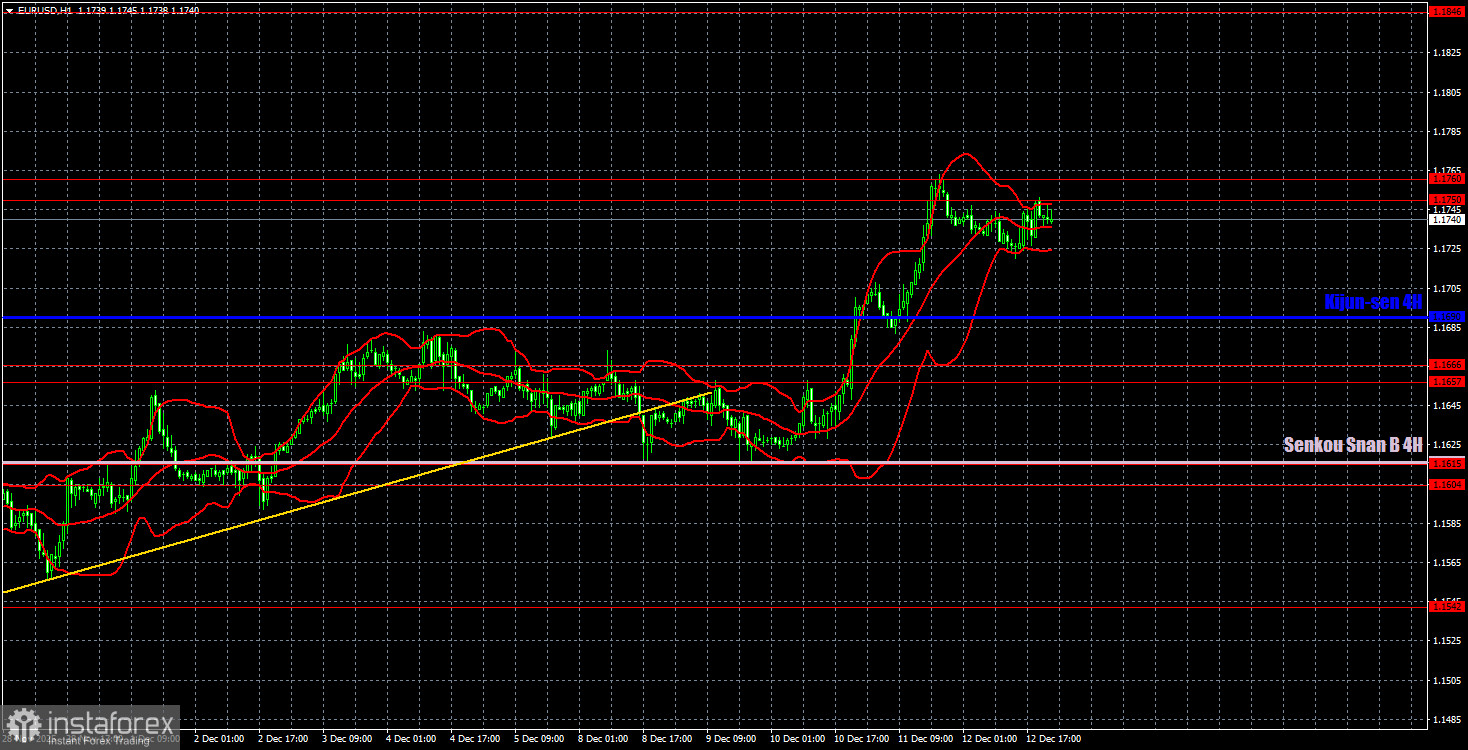
On the hourly timeframe, the EUR/USD pair continues its upward movement, in line with our expectations. As we warned, it is not wise to rush to conclusions about the end of the upward trend until there is a consolidation below the Senkou Span B line. The price remains within the sideways channel of 1.1400-1.1830 on the daily timeframe, so further strengthening of the euro toward the level of 1.1800 can still be anticipated. We also expect the upward trend of 2025 to resume in December.
For December 15, we highlight the following trading levels: 1.1234, 1.1274, 1.1362, 1.1426, 1.1542, 1.1604-1.1615, 1.1657-1.1666, 1.1750-1.1760, 1.1846-1.1857, 1.1922, 1.1971-1.1988, as well as Senkou Span B (1.1616) and Kijun-sen (1.1690) lines. The Ichimoku indicator lines may shift throughout the day, which should be considered when determining trading signals. Don't forget to set a Stop Loss order to breakeven if the price moves in the correct direction by 15 pips. This will safeguard against potential losses if the signal turns out to be false.
On Monday, a joint report is scheduled for the Eurozone and the US: industrial production in the EU. This report is not the most important, so we do not expect strong movements today. The EUR/USD pair will face a significant technical dilemma soon – to conclude the flat on the daily timeframe or to remain in the sideways channel of 1.1400-1.1830.
On Monday, traders may trade from the area of 1.1750-1.1760. A price bounce from this area will allow traders to open short positions targeting the Kijun-sen line at 1.1690. Overcoming the specified area will allow for holding long positions or opening new ones with targets at 1.1800-1.1830 and 1.1846.


