Veja também

 23.03.2026 11:21 AM
EUR/USD
Analysis:
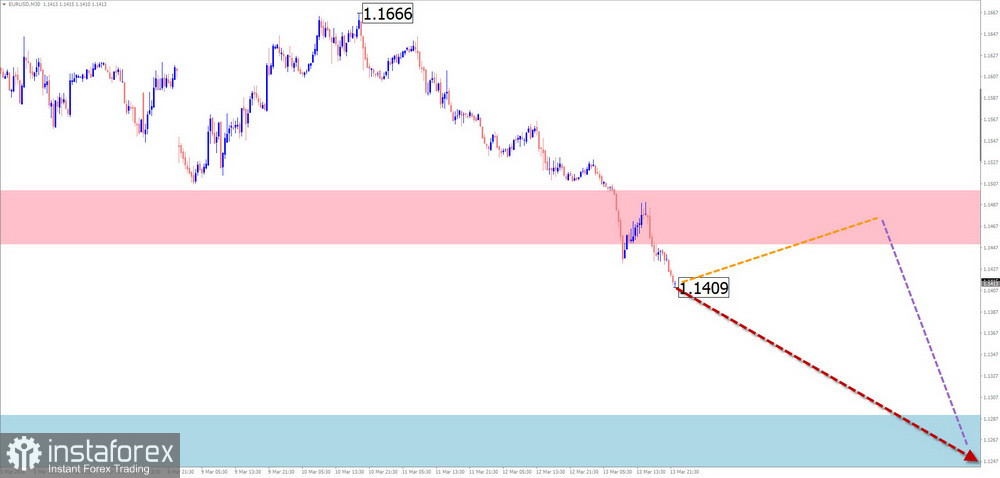
Quotes of the main European currency pair continue the short-term downward trend that began at the end of February this year. Prices are within the boundaries of a potential reversal zone on the hourly timeframe. Over the past three weeks, the price has been forming a counter flat correction. Its structure is not yet complete at the time of analysis.
Forecast:
In the coming week, the overall sideways movement of the euro between the nearest opposing zones is expected to continue. An upward movement is more likely in the first days, reaching the calculated resistance. After that, a reversal and renewed price decline can be expected.
Potential Reversal Zones
Resistance:
Support:
Recommendations:
USD/JPY
Analysis:
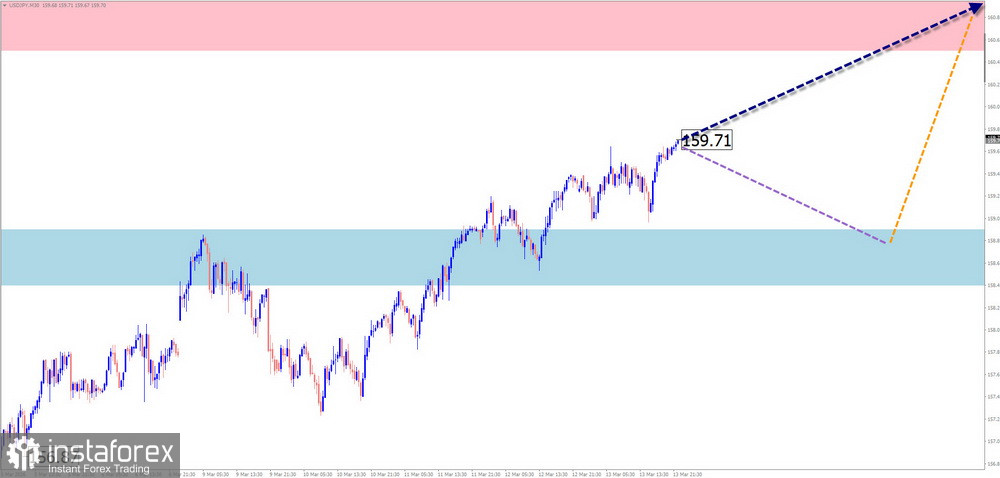
On the chart of the Japanese yen major pair, the short-term trend direction aligns with the global trend. Since the end of January this year, price movement has been driven by a bullish wave algorithm. Over the past two weeks, a corrective phase formed. At the end of last week, an upward segment with reversal potential began.
Forecast:
In the coming days, sideways movement along the support zone is expected. Then, activation and continuation of upward movement toward the resistance zone are likely. A trend reversal may occur closer to the weekend amid increased volatility.
Potential Reversal Zones
Resistance:
Support:
Recommendations:
GBP/JPY
Analysis:
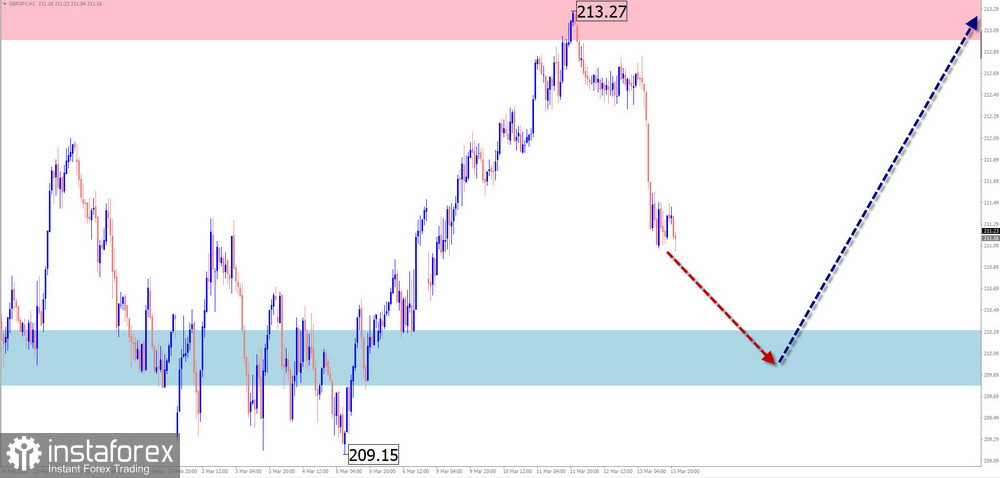
Fluctuations of the British pound/Japanese yen pair have followed a downward wave pattern since December last year. Over the past two months, the middle part of a zigzag wave (B) has been forming and is close to completion. The pair is currently near the lower boundary of a strong potential reversal zone.
Forecast:
At the start of the week, a short-term rise toward resistance is possible. Closer to the weekend, increased volatility, reversal, and continuation of the downward trend are more likely. The lower boundary is defined by the support zone.
Potential Reversal Zones
Resistance:
Support:
Recommendations:
USD/CAD
Analysis:
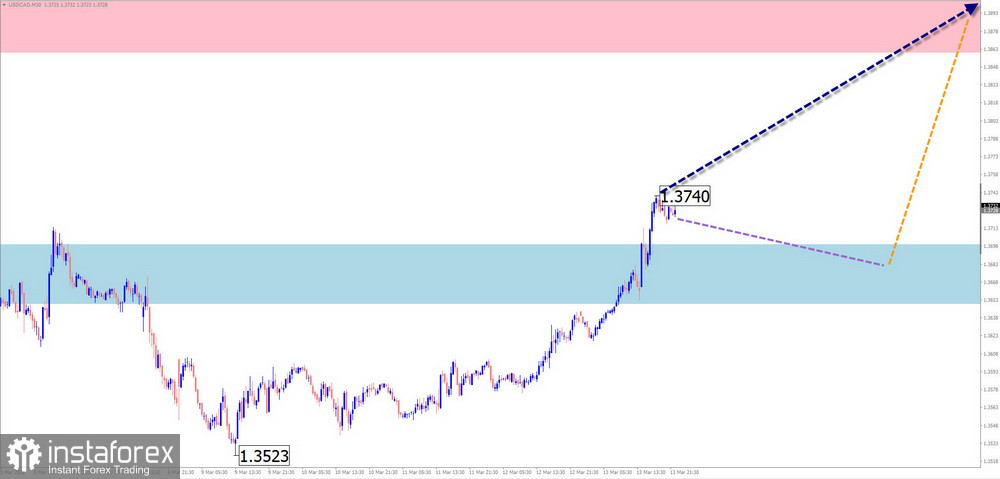
On the chart of the Canadian dollar major pair, an unfinished upward wave model has been developing since the end of January. The final part (C) is forming and is not yet complete. Price is moving sideways between reversal zones of different timeframes, forming an intermediate pullback.
Forecast:
After a likely sideways phase, a renewed decline toward support is possible. By the end of the week, the probability of bullish movement resuming toward resistance increases.
Potential Reversal Zones
Resistance:
Support:
Recommendations:
Bitcoin
Analysis:
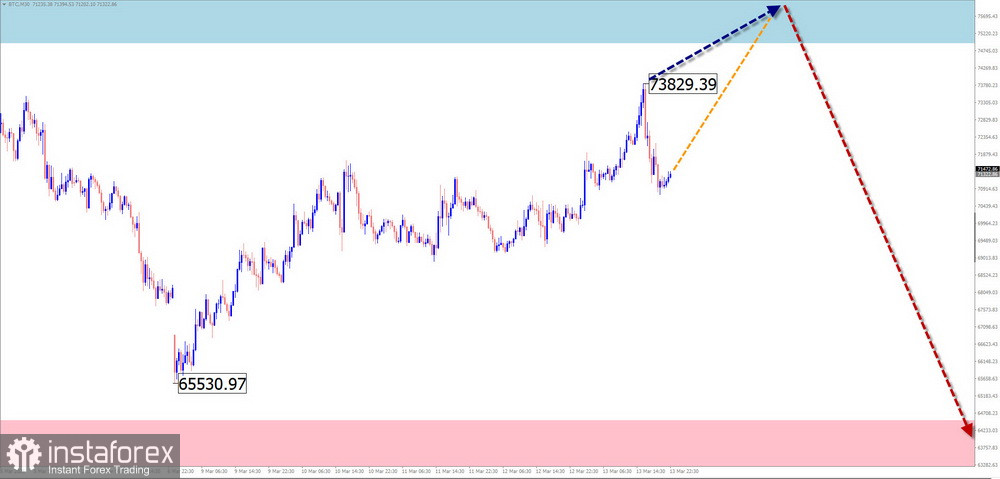
Bitcoin continues its downward movement within an unfinished bearish wave structure that began in July last year. The structure shows a developing intermediate correction (B), which is not yet complete. Price has broken through a strong support zone, which has now turned into resistance.
Forecast:
During the coming week, continued price decline from resistance toward support is expected. In the near term, a brief test of the upper resistance boundary is possible.
Potential Reversal Zones
Resistance:
Support:
Recommendations:
Ripple
Analysis:
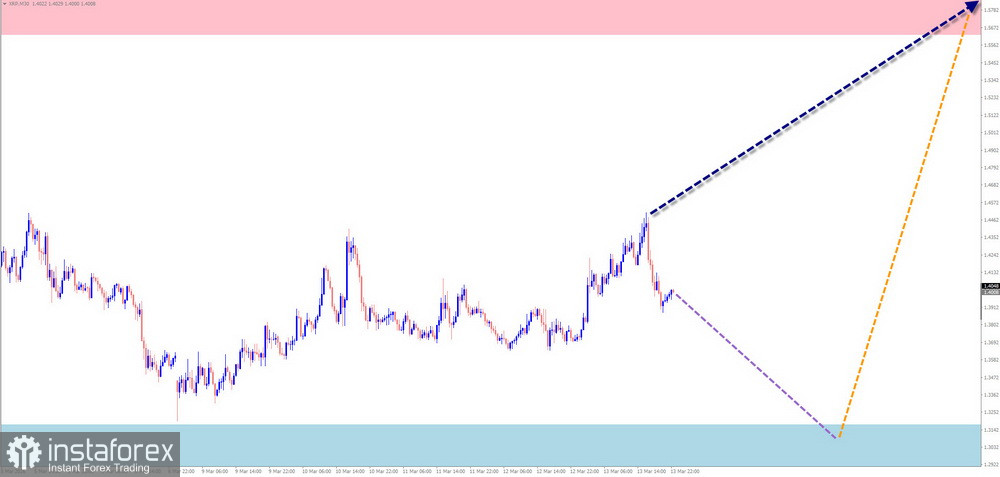
Ripple prices are within a cluster of several strong reversal levels across different timeframes. Within the dominant upward wave that started in early February, the middle segment (B) is developing and not yet complete. After it ends, the short-term bullish trend is expected to continue.
Forecast:
During the coming week, completion of the price decline, formation of a reversal near support, and a renewed upward move are expected. The upper boundary is defined by the resistance zone.
Potential Reversal Zones
Resistance:
Support:
Recommendations:
Notes:
In simplified wave analysis (SWA), all waves consist of three parts (A–B–C). The latest unfinished wave is analyzed on each timeframe. Dashed lines indicate expected movements.
Attention: The wave algorithm does not account for the duration of price movements over time.


