Vea también

 06.03.2026 10:45 AM
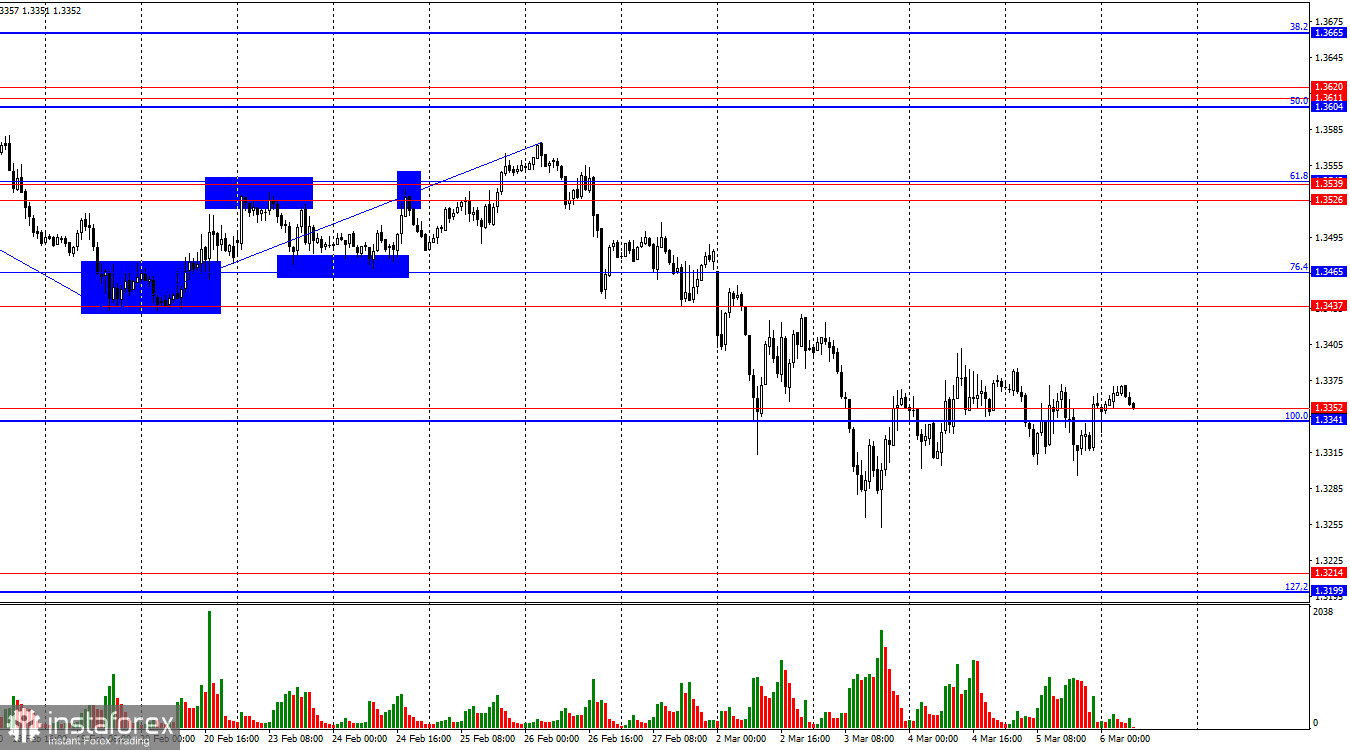
On the hourly chart, the GBP/USD pair on Thursday made several attempts to consolidate around the 1.3341–1.3352 level, but overall this area is currently being ignored by traders. A consolidation above it would allow expectations for continued growth toward the resistance level of 1.3437–1.3465. A consolidation below 1.3341–1.3352 would allow expectations for a decline toward the support level of 1.3199–1.3214.
The wave situation remains "bearish." The last completed upward wave failed to break the previous peak, while the new downward wave broke the previous low. For the trend to shift to bullish, either a consolidation above the last peak at 1.3573 is required or two consecutive bullish waves—something that is unlikely in the near term. The information background for the British currency has been weak in recent months, while geopolitics currently gives bears a clear advantage in the market.
The news background on Thursday was neutral for both the dollar and the British pound. However, today is a different story. In the second half of the day, four notable reports will be released in the United States, two of which are particularly important. This week traders have not shown much interest in economic data because all attention was focused on the war in Iran. However, the Iran topic is gradually fading, which is quite natural—the market cannot react to every new strike from either side.
Today economic data will be especially important, as inflation is expected to rise globally, and the United States is no exception. Rising energy prices will inevitably lead to higher logistics and production costs across all types of goods. As a result, the Federal Reserve may continue to remain silent in the coming months. However, not everything in the U.S. depends on inflation. In my view, the labor market in January did not show a significant recovery compared with 2025. U.S. economic growth slowed to 1.4% in the fourth quarter. It is possible that the Federal Reserve may once again need to stimulate both the labor market and the economy in the near future. Whether the labor market actually needs such stimulus will be answered by today's Nonfarm Payrolls and unemployment rate reports.
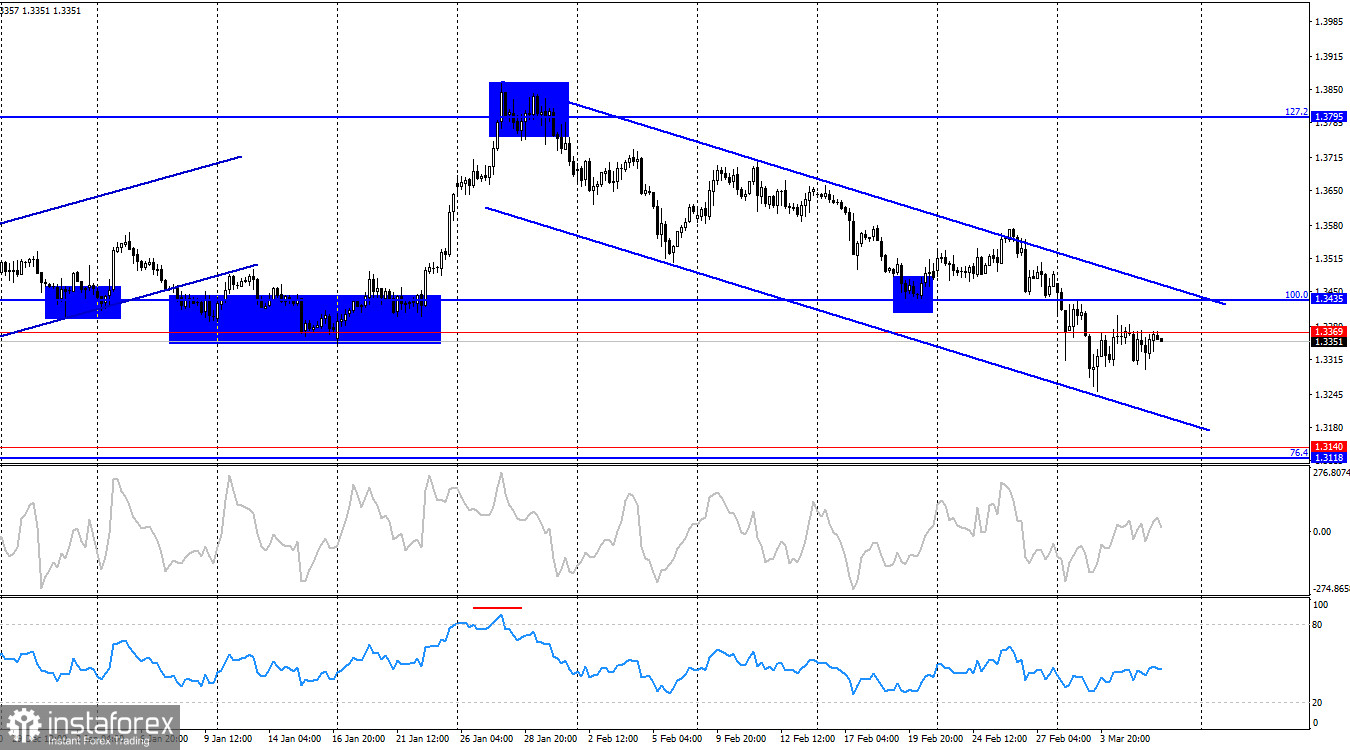
On the 4-hour chart, the pair rebounded from the upper boundary of the downward trend channel, reversed in favor of the U.S. dollar, and closed below the support level of 1.3369–1.3435. Therefore, the downward movement may now continue toward the 1.3118–1.3140 level. A close above the downward channel would suggest the end of the bearish trend. No emerging divergences are currently observed on any indicators.
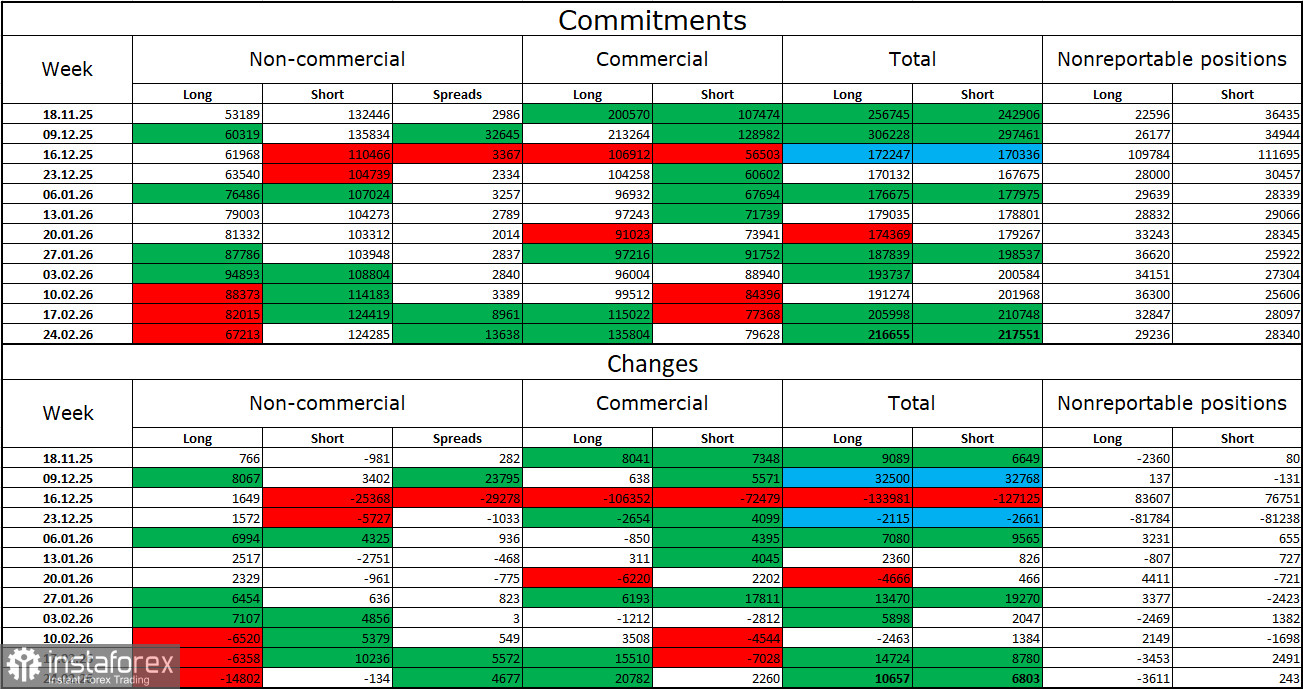
The sentiment among Non-commercial traders became more bearish over the latest reporting week, which no longer looks accidental under current conditions. The number of long positions held by speculators decreased by 14,802, while short positions decreased by 134. The gap between long and short positions now stands at roughly 67,000 vs. 124,000.
In recent months, bears have more often dominated, although the situation with contracts in the euro currency is the opposite. I still do not fully believe in a sustained bearish trend for the pound, but now everything will depend not on economic indicators or Trump's trade policy, but on the duration and scale of the war in the Middle East.
Over the past year, the pound looked like a safer currency compared with the dollar—more stable and with a clearer economic outlook. However, in recent months there was first a correction while the bullish trend remained intact, and then the Middle East conflict began escalating almost daily. Negotiations on an agreement between the United States and Iran failed, so the dollar is now rising due to geopolitical factors. How long the dollar will continue rising depends on developments in the Middle East.
United States
On March 6, the economic calendar contains at least two major events. The impact of the news background on market sentiment on Friday could be strong in the second half of the day.
Selling the pair is possible today if the hourly chart closes below the 1.3341–1.3352 level, with a target of 1.3199–1.3214. Buying could be considered if the pair closes above 1.3341–1.3352 on the hourly chart, targeting 1.3437–1.3465. However, since traders have largely ignored the 1.3341–1.3352 level in recent days, it may also be reasonable not to trade from this level.
Fibonacci grids are built from 1.3341–1.3866 on the hourly chart and 1.3431–1.2104 on the 4-hour chart.


