
Vea también


 02.10.2026 05:37 AM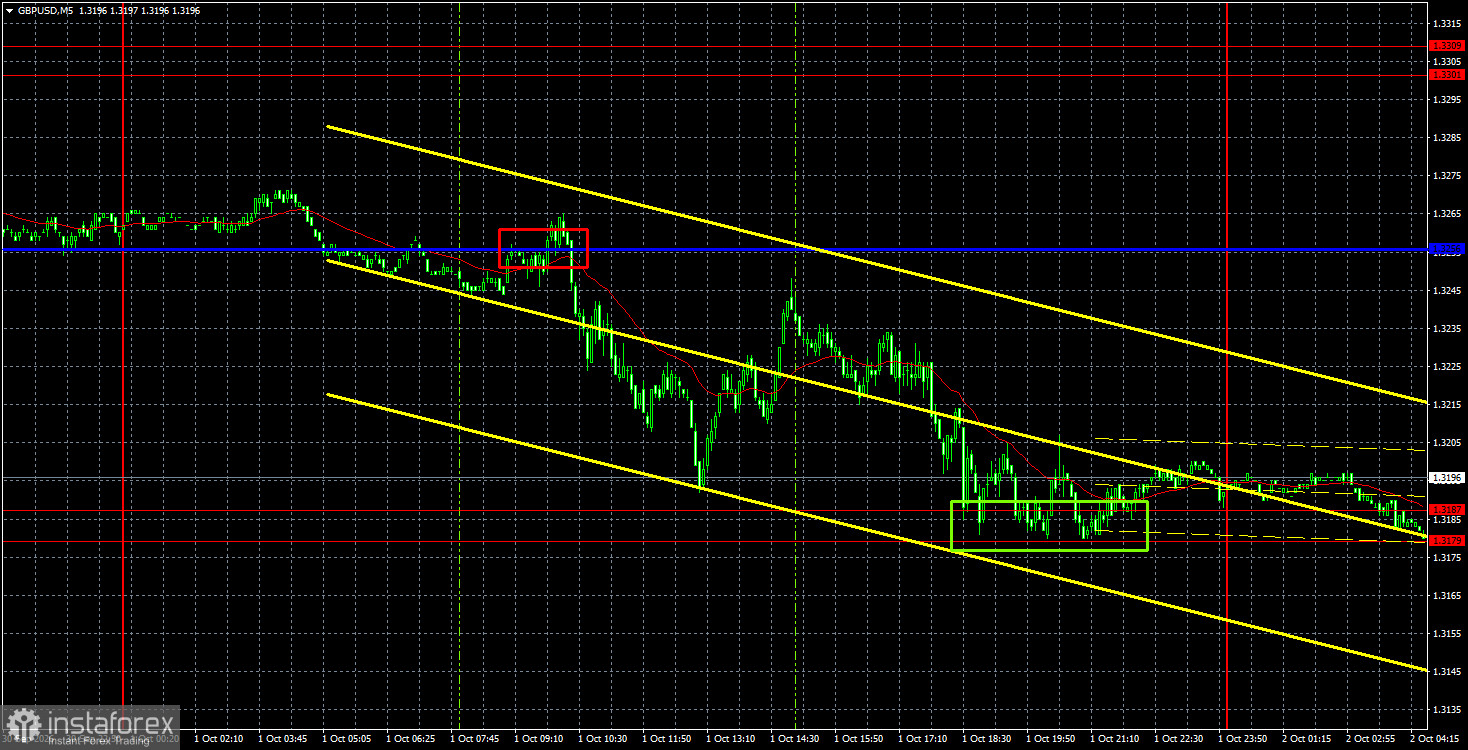
The GBP/USD currency pair on Thursday resumed its downward movement, did not avoid a new drop, but still managed to hold within the 1.3180–1.3300 range. In current circumstances, this is already a small victory for the British currency. At the same time, the euro continues to tumble, so the pound shows greater resilience against the dollar. As for the reasons for the latest rise of the US currency, it's simple — there were none. Of course, there are reasons in reality, but they aren't obvious ones like a macro report, a change in market expectations for monetary policy, a high-ranking official's speech, or a shift in the geopolitical situation. Yesterday, the US published the important ISM manufacturing PMI, which came in at 54.5 versus forecasts of 55.0. It isn't weak, but it still came in below forecasts. That gave the dollar grounds to fall. But the market didn't even notice that report — like many other events recently.
Technically, the British pound continues to form a downward trend, as shown by the trendline and price below the Ichimoku indicator lines. Under current circumstances, the pound sterling can expect, at most, a correction within the downtrend. Despite the absence of local factors for decline, the market currently shows no willingness to buy the British currency.
On the 5-minute TF, two trading signals were formed on Thursday. First, the pair broke the critical line and fell to the 1.3179–1.3187 area, then it bounced off that area. The first sell trade yielded 50 pips of profit on short positions. The second — so far, nothing.
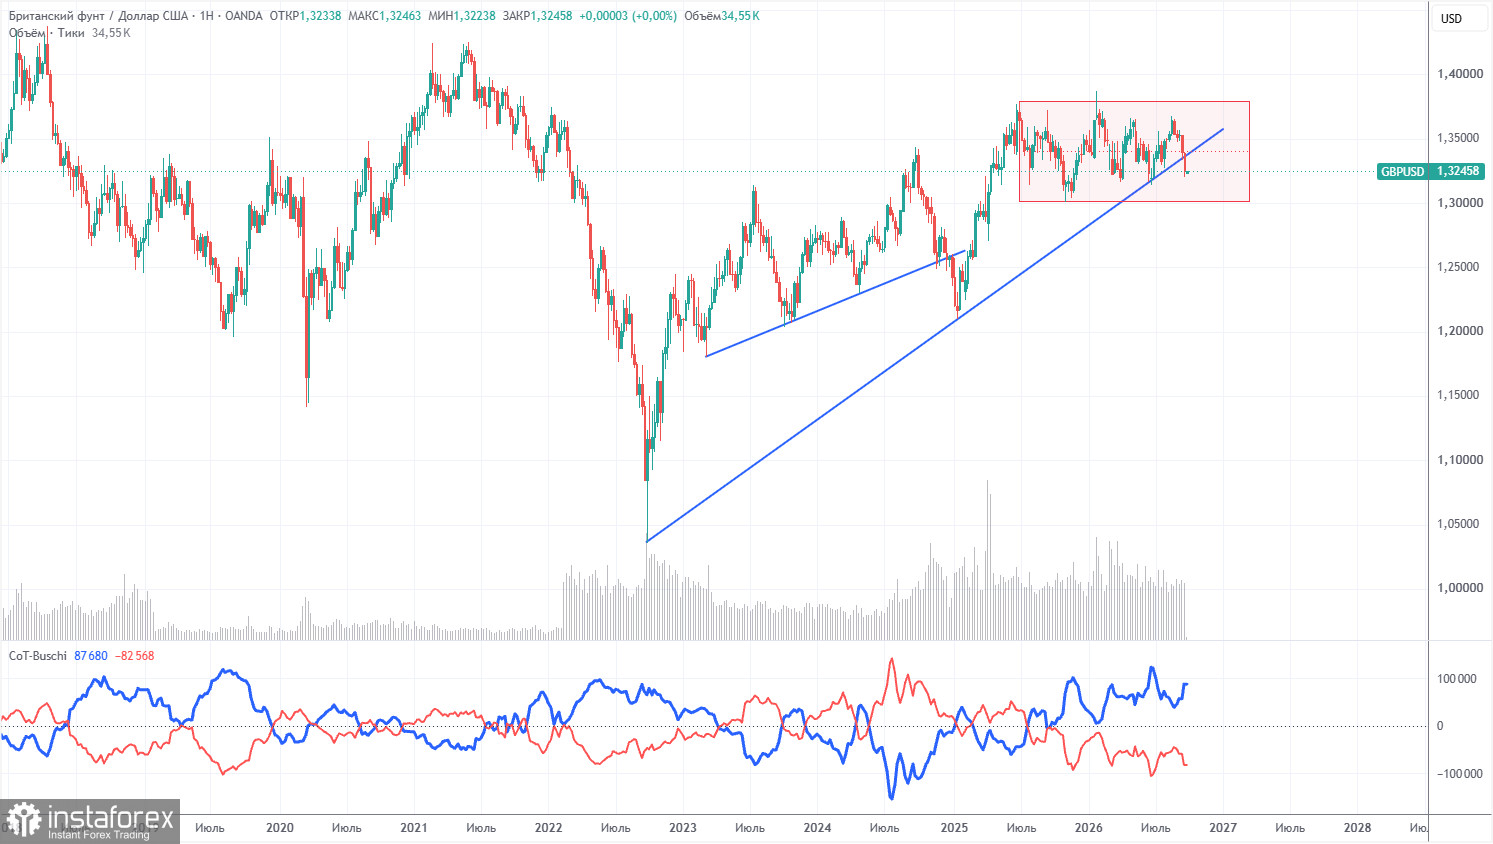
COT reports for the pound show that non-commercial traders have dominated the market with sales for several months in a row. The net position is negative despite the preservation of an uptrend in the long term. Given events in the Middle East, it is unsurprising that dollar demand was quite high in the first half of 2026. The war has formally ended, but the conflict persists. The Fed's changed stance on monetary policy again supported the dollar, and the uptrend line was breached. However, it was breached in flat conditions, so we do not believe the uptrend is finished.
In the long term, the dollar continues to decline due to Donald Trump's policies, which is clearly visible on the weekly TF. The trade war will continue in one form or another for a long time, and Trump's policies aim directly and indirectly to weaken the US currency. The long-term uptrend remains intact. According to the latest COT report (dated September 22), the "Non-commercial" group closed 14,900 BUY contracts and opened 8,900 SELL contracts. Thus, non-commercial traders' net position increased by 23,800 contracts over the week.
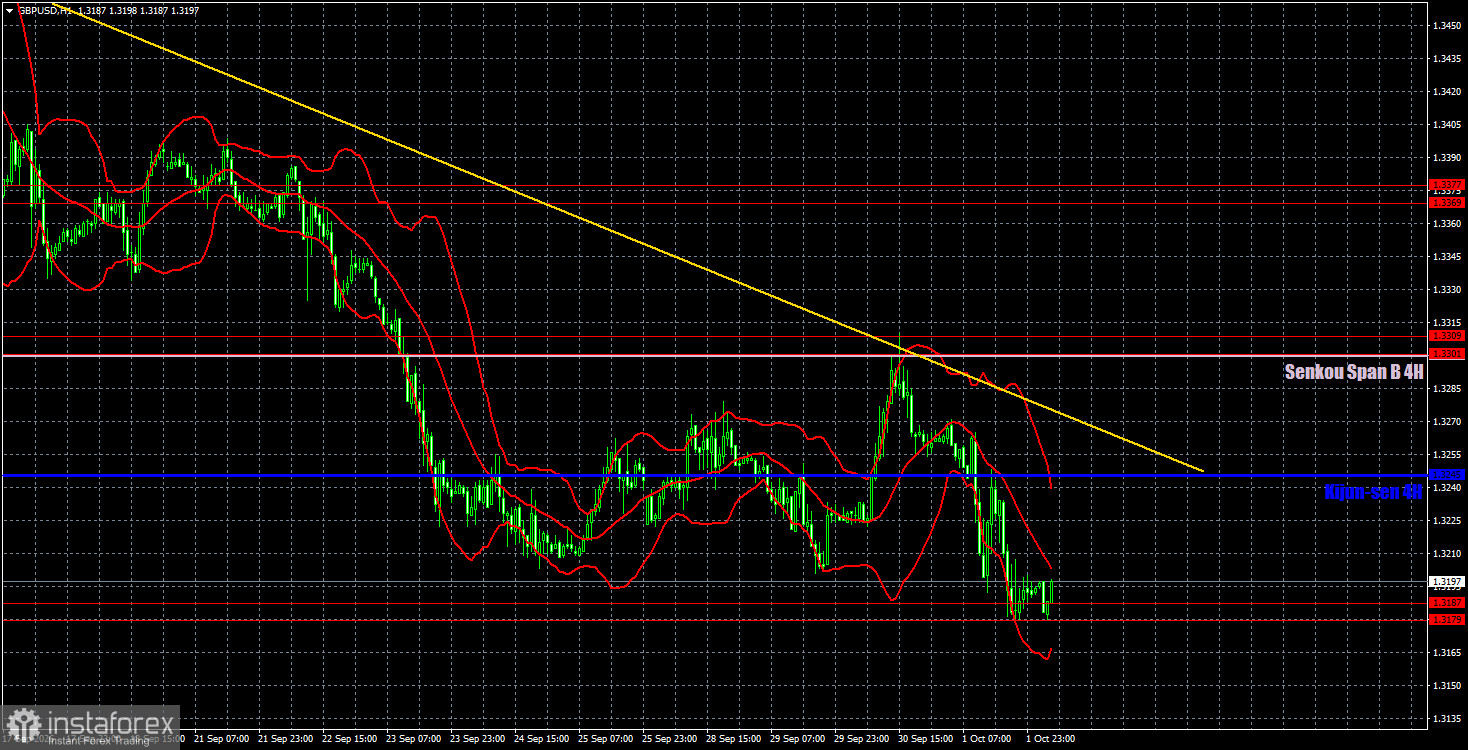
On the hourly timeframe, the GBP/USD pair continues to form a downward trend. The Federal Reserve's decision and stance have greatly changed the prospects for the US dollar and the market's attitude toward it. We would say that for the second time this year, a "black swan" has arrived in the market, bringing excellent news for the dollar when no one expected it. However, now the US currency's rise no longer relates to the Fed's key rate.
For October 2 we highlight the following important levels: 1.3042–1.3050, 1.3096–1.3115, 1.3179–1.3187, 1.3301–1.3309, 1.3369–1.3377, 1.3465–1.3480, 1.3588, 1.3671–1.3681. The Senkou Span B (1.3301) and Kijun-sen (1.3245) lines can also be sources of signals. It is recommended to move the Stop Loss to breakeven when the price has moved 20 pips in the correct direction. The Ichimoku indicator lines may shift during the day, which you should take into account when determining trading signals.
No major publications or events are scheduled today in the UK, while the US will release key labor and unemployment reports that may provoke a strong market reaction. Volatility may be high today.
Traders can consider the 1.3096–1.3115 area as a target for short positions if the price consolidates below the 1.3179–1.3187 area. A bounce from the 1.3179–1.3187 area would make 1.3245 and 1.3301 targets for long positions.


