
یہ بھی دیکھیں


 01.10.2026 09:29 AM
Yesterday, Bitcoin reacted to the inflation data, but that was it. The price jumped above $85,000 to $85,600 and quickly fell back to $84,300, while total crypto market capitalization rose only 0.6% and stayed just below $3 trillion. It is worth noting that quotes have been holding in a narrow range with low volatility for quite some time. Such a lull usually ends with a sharp move, and uncertainty around Federal Reserve policy is now noticeably greater than before, so the breakout from the range can occur in either direction.

The data themselves show the reason for caution. The PCE index, which the Fed considers the main inflation gauge, rose 0.3% in August and 3.4% year-on-year, while economists expected 0.4% and 3.7%. In the previous report, the annual figure was 3.7%, so the slowdown is significant. Core PCE excluding food and energy rose 0.2% month-on-month and 3.0% year-on-year, below forecasts of 0.3% and 3.3%. These figures change the October conversation: according to CME FedWatch, the probability of a pause is now 63%, and a 25 bp hike is 37%.
The background for Bitcoin remains heavy. The 10-year Treasury yield on Tuesday reached about 5.25%, the highest since 2002, and such risk-free yield pulls money away from non-yielding assets.
Traders now estimate the probability of a new all-time high before 2027 at only 7%, given the previous record of $126,199.63 — Bitcoin would need to rise roughly 50% in three months to reach that.
I expect the exit from the range in the coming days, possibly after Friday's US labor market data, and if the market continues to price in rate cuts rather than hikes, Bitcoin has a better chance of moving up toward $86,000 than down. The picture for Ether is similar but with less momentum. This scenario would be invalidated by Bitcoin settling below $83,500 amid rising yields or oil, in which case a return to a deeper correction would be the topic of discussion.
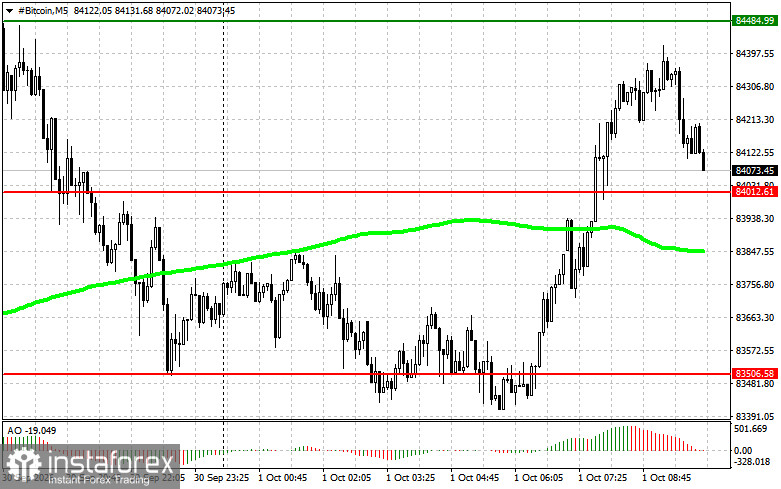
Bitcoin is holding between support at 84,000 and resistance at 84,500, and the plan is built around this range. For buying, the first option is a confirmed breakout of 84,500 upward with a target of 84,800, where I would lock in profits and consider reversing into a short on the pullback, provided the price remains above the 50-day moving average and the Awesome Oscillator is above zero. The second option works if the downside breakout is not confirmed: a rejection off 84,000 or a false spike down to 83,500 opens a buy position with an initial return to 84,500 and then to 84,800.
For selling, the conditions are mirrored. A confirmed breakdown of 84,000 down gives a short position with a target of 83,500, but only when the 50-day moving average is above the price, and the Awesome Oscillator has fallen below zero. If the breakout above 84,500 is not confirmed and price rejects that level, the short targets a return to 84,000 and then to 83,500.
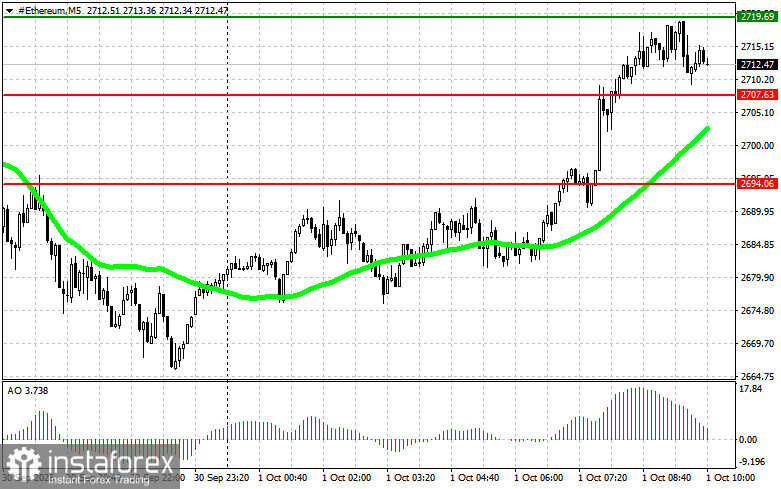
For Ether, the logic repeats Bitcoin on its own scale: the working range lies between support 2,707 and resistance 2,719. Buy on a breakout of 2,719 upward with a target of 2,731, where profits are taken and a short on the retracement is allowed, or on a rejection from 2,707 or a false spike down to 2,694, in which case the targets are first 2,719 and then 2,731. Sell is possible on a confirmed breakdown of 2,707 down to 2,694, or on a rejection from 2,719 after the upside breakout failed, with targets first 2,707 then 2,694. The conditions regarding the 50-day moving average and the Awesome Oscillator are the same as for Bitcoin. Both indicators remain filters to weed out false moves rather than reasons to enter early, so the decision is made only after price actually confirms the stated levels.


