
See also


 26.08.2026 09:36 AM
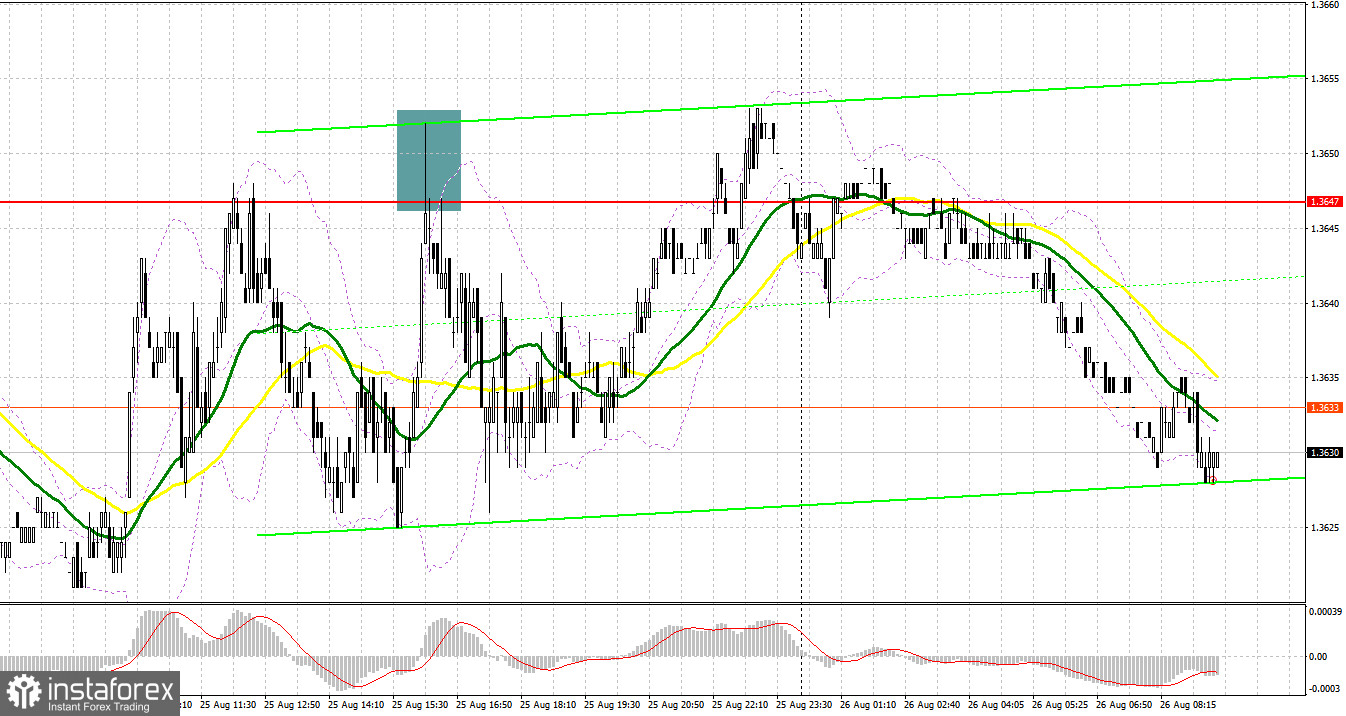
Yesterday, several entry points into the market were formed. Let's take a look at the 5-minute chart and analyze what happened there. In my morning forecast, I pointed out the level of 1.3647 and planned to decide whether to enter the market from that level. The rise and formation of a false breakout around 1.3647 created an entry point to sell the pound, resulting in a 17-pip decline for the pair. In the second half of the day, the same story at 1.3647 repeated, resulting in a 15-pip decline for the pair.
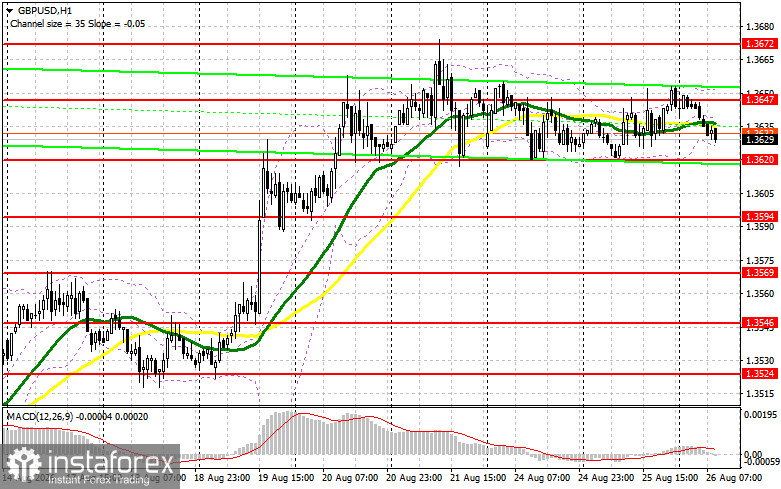
Yesterday, the dollar declined against the British pound after a couple of weak U.S. reports. New home sales in July fell to 607,000 on an annual basis, down from 678,000 in June. The average price also decreased to $393,800. The Conference Board consumer confidence index in the U.S. fell for the second consecutive month to 89.4 from 90.2. Today, in the first half of the day, we are expecting retail sales data from the Confederation of British Industry, and poor figures will quickly put pressure back on the pair, bringing it to the nearest support at 1.3620. Only the formation of a false breakout there, similar to what I discussed above, can provide an entry point for long positions with a recovery to the level of 1.3647, which has not been able to break out of for several days. A breakout and a reverse test from the top to the bottom of this range will increase the chances of GBP/USD strengthening, leading to the removal of stop orders from sellers and a suitable entry point for long positions, with the possibility of moving to 1.3672. There, I expect more active bear activity. The most distant target will be at 1.3707, where I plan to take profit. In the event of a decline in GBP/USD and a lack of buying activity at 1.3620, pressure on the pound will increase. This will open the way to the next support at 1.3594. Only the formation of a false breakout there will be a suitable condition for opening long positions. I plan to buy GBP/USD immediately on a rebound from the low of 1.3569, aiming for a 30-35-pip intraday correction.
Despite all the attempts by bears, the pair continues to trade within the sideways channel, maintaining all chances of continuing the bullish market. In the event of GBP/USD rising on the back of a good retail sales report, sellers will need to work hard to defend the resistance at 1.3647 again. Only the formation of a false breakout there, similar to what I discussed above, will provide an entry point for selling towards the support at 1.3620, which has been tested more than four times in the last three days. A breakout and a reverse test from the bottom to the top of this range will deal a larger blow to buyers' positions, leading to the removal of stop orders and opening the way to support at 1.3594. The most distant target will be the area of 1.3569, where I will take profit. In the event of an upward move in GBP/USD and a lack of activity at 1.3647, buyers will have the opportunity to extend the bullish trend. This will open the road to the area of 1.3672. I also plan to open short positions there only on a false breakout. In the absence of downward movement even there, I will sell GBP/USD immediately on a rebound from 1.3707, but only in anticipation of a downward correction of the pair by 30-35 pips intraday.
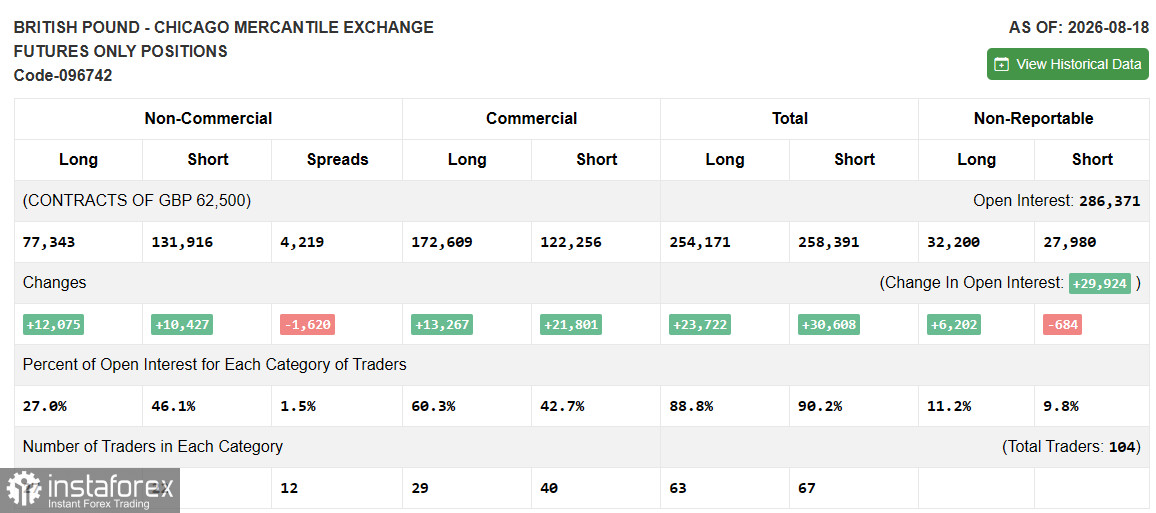
In the COT report (Commitment of Traders) for August 18, there was an increase in long and short positions observed. The market has sharply come to life: open interest soared by +29.9 thousand contracts. But the main point is the behavior of hedgers: for the first time in a long time, they increased shorts faster than longs, +21.8 thousand against +13.3 thousand, reducing the net long to +50.4 thousand. This indicates that smart money is being cautious. Speculators hold a stable net short of 54.6 thousand, while retail — a contrarian indicator — has been buying actively. This combination of retail buying and hedgers protecting against declines often precedes a correction.
Moving Averages
Trading is taking place around the 30- and 50-day moving averages, indicating the sideways nature of the market and consolidation.
Note: The periods and prices of moving averages are considered by the author on the hourly chart H1 and differ from the overall definition of classic daily moving averages on the daily chart D1.
Bollinger Bands
In the event of a decline, the indicator's lower boundary around 1.3620 will act as support.


